


NowPrice:AU$26.16
Original Price: AU$32.70
20% off
Sale ends on 01 April
Python Portfolio Optimization Tool | Efficient Frontier & Sharpe Ratio
You can only make an offer when buying a single item.
Highlights
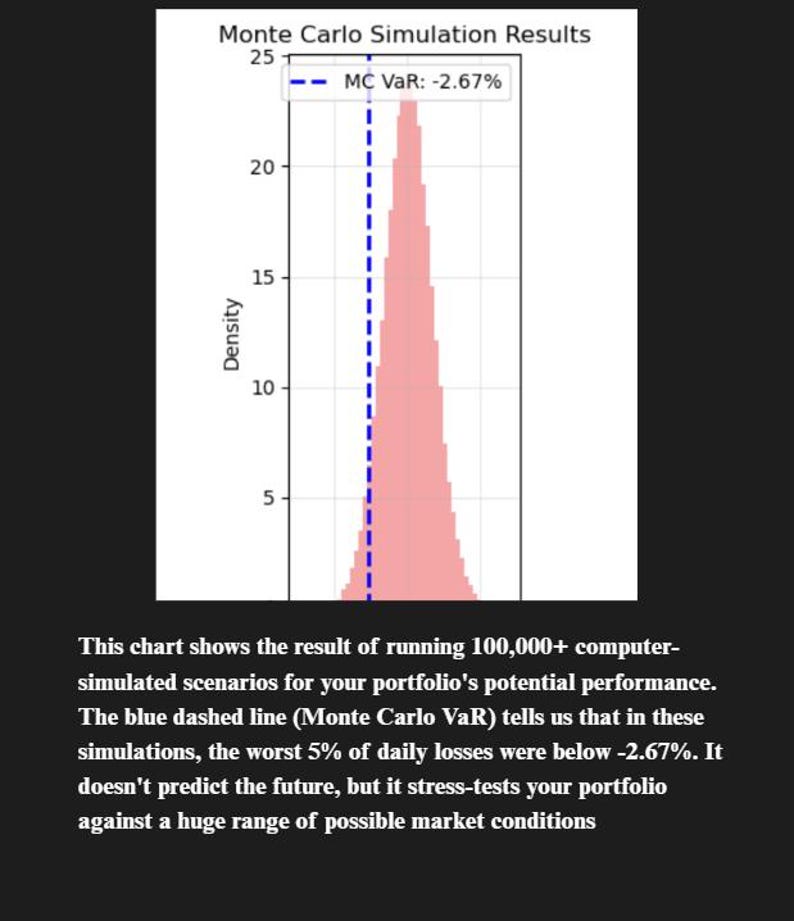
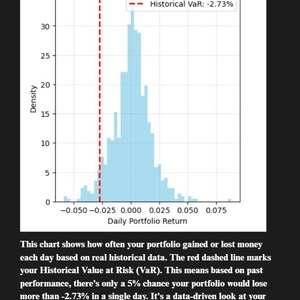
🚀 Automate Your Stock Analysis with Python! This powerful script performs professional-level portfolio optimization, calculating the Efficient Frontier, Sharpe Ratio, and Value at Risk (VaR) to help you build a smarter investment portfolio. Perfect for learning Data Science & Python.
✨ INSTANT DOWNLOAD | 🐍 BEGINNER-FRIENDLY | 📈 PROFESSIONAL TECHNIQUES
What You Get:
A ready-to-run Jupyter Notebook (.ipynb) & Python script.
A step-by-step PDF guide for absolute beginners.
Batch files (*.bat) for one-click installation & execution.
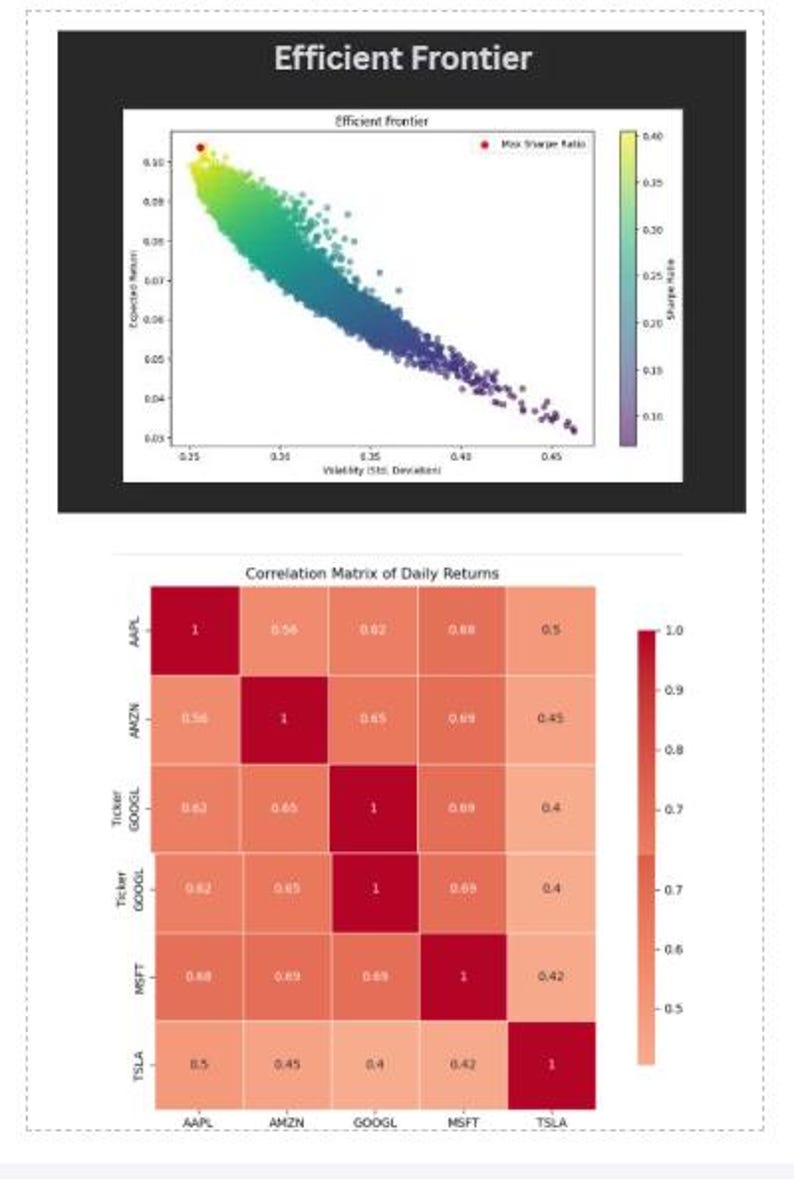
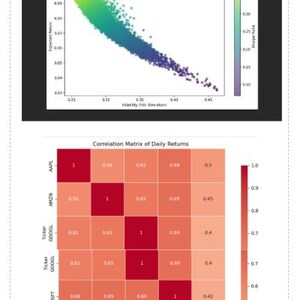
Outputs: Optimal Portfolio Weights, Correlation Heatmap, Efficient Frontier Graph, and Risk Reports.
What It Is NOT:
NOT financial advice. The creator is not a licensed financial advisor.
NOT a prediction tool. It analyzes past data, which does not guarantee future results.
NOT a profit guarantee. All investing involves risk, including loss of principal.
Users are solely responsible for their own investment decisions.
Section 2: Installation Guide
Aimed at absolute beginners, the installation process involves two simple steps:
Install Python: Download the latest version from python.org. Crucially, users must check the "Add Python to PATH" box during installation.
Install Dependencies: Double-click the install_dependencies.bat file. A terminal window will open and install the necessary libraries. The user closes the window once it says "Successfully installed."
Section 3: How To Use The Tool
Add Your Stocks:
Edit the main.py file with a text editor like Notepad or Notepad++.
Locate the line: TICKERS = ['AAPL', 'MSFT', 'GOOGL', 'AMZN', 'TSLA']
Replace the example ticker symbols with your own, keeping the formatting with quotes and commas (e.g., TICKERS = ['NVDA', 'V', 'JPM']).
Save the file.
Run the Analysis:
Double-click the run_analysis.bat file.
A terminal window will open, show a progress bar for downloading data, and print results.
Two graphs will automatically appear and the results will be saved as CSV and PNG files in the folder.
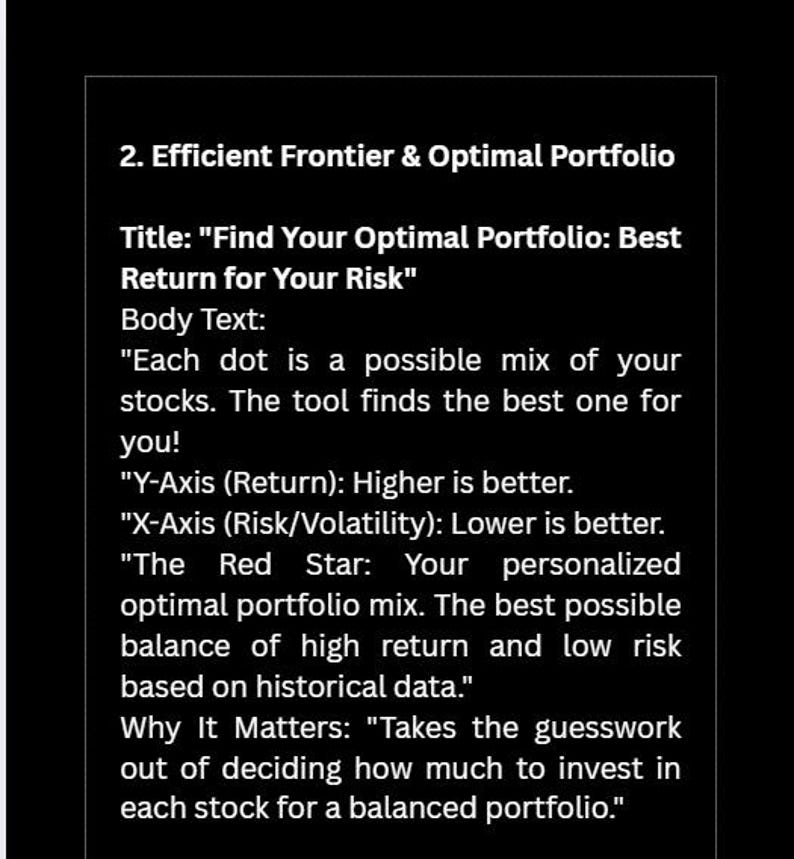
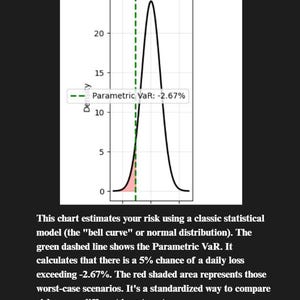
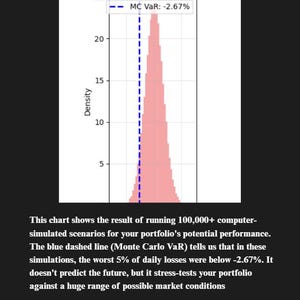
Section 4: Understanding The Results
The tool generates four key outputs:
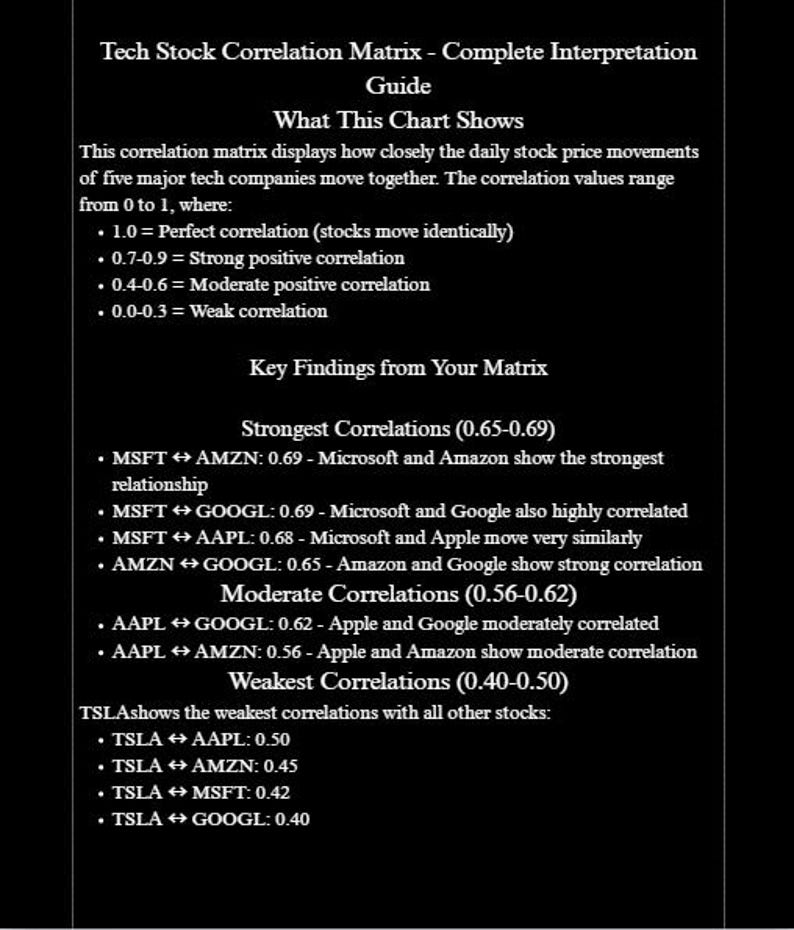
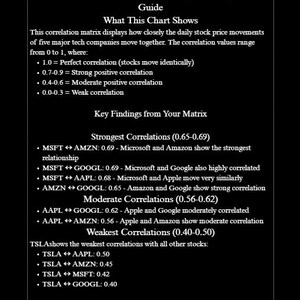
Correlation Heatmap: A chart showing how similarly stocks move together.
Dark Red: Highly correlated (move together).
Dark Blue: Uncorrelated or move opposite (good for diversification
Instant Download
Your files will be available to download once payment is confirmed. Here's how.
Instant download items don’t accept returns, exchanges or cancellations. Please contact the seller about any problems with your order.
Etsy Purchase Protection
Shop confidently on Etsy knowing if something goes wrong with an order, we've got your back for all eligible purchases —
see programme terms

Be the first to review this item

More from this shop
Visit shop-
Digital download
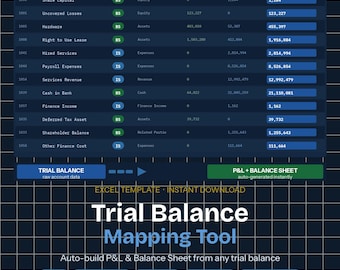
Trial Balance to Financial Statements Excel | Chart of Accounts Mapping Tool for Accountants & Bookkeepers
Sale Price AU$16.99
Original Price AU$21.24
-

Digital download
AI Model Regularization for Finance | Prevent Overfitting in Forecast Models
Sale Price AU$24.85
Original Price AU$31.06
-

Digital download
AI Data Science Interview Prep Bundle Python Machine Learning FAANG Questions Set
Sale Price AU$40.53
Original Price AU$50.67
-
Digital download
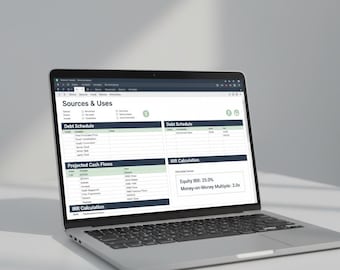
Essential LBO Model Excel | Beginner-Friendly Buyout Template with IRR Calculator | Private Equity Analysis
Sale Price AU$24.84
Original Price AU$31.04
-

Digital download
Python for Financial Analysis: Investment and Portfolio Management
AU$11.44
-
Digital download
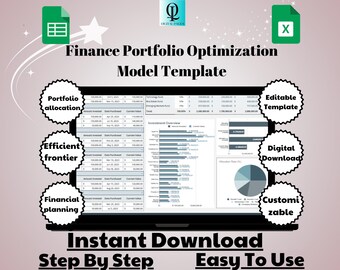
Finance Portfolio Optimization Model Template: Google Sheets Investment Tool (Digital Download)
Sale Price AU$8.17
Original Price AU$16.35
-
Digital download
The Handbook of Fixed Income Securities, Ninth Edition.
Sale Price AU$18.31
Original Price AU$45.78
-

Digital download
Stock Scan: USA Market
AU$16.35
-
Digital download
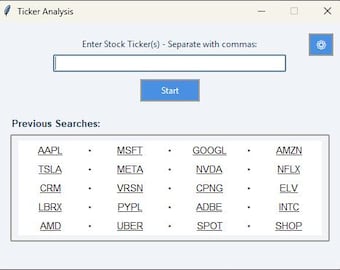
Stock Analysis Tool
AU$32.68
-
Digital download
Quant Trading Book Bundle: Python, Algos, Options, Forex (PDF Download)
Sale Price AU$7.51
Original Price AU$30.01


