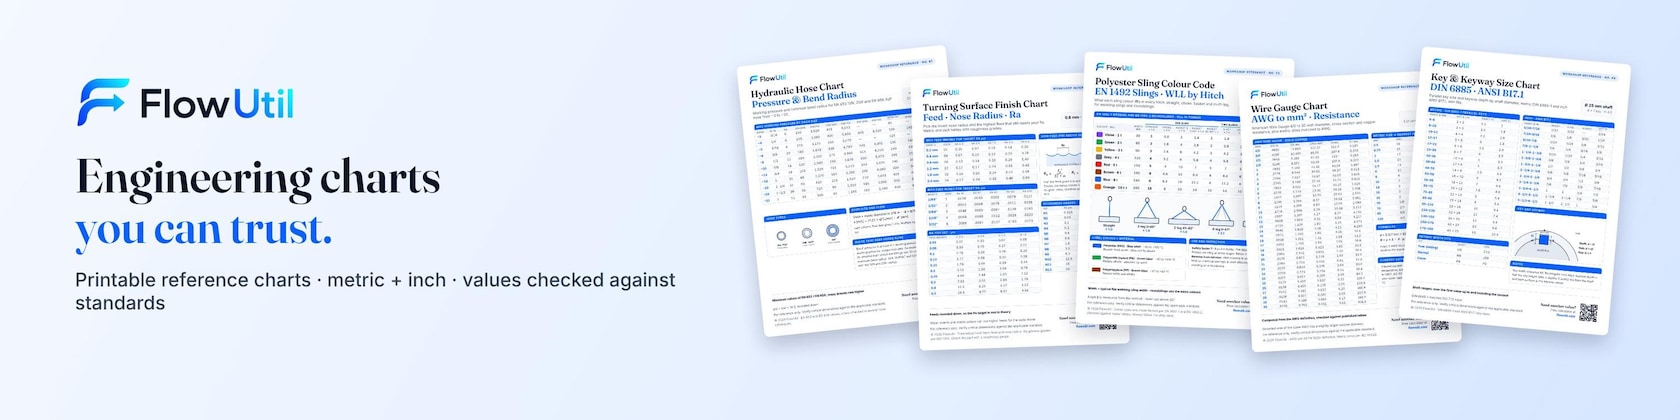





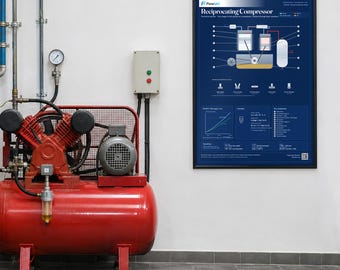

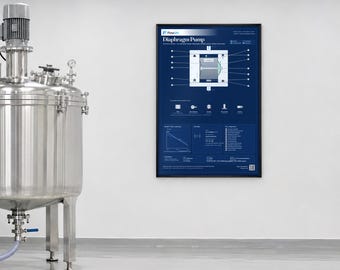
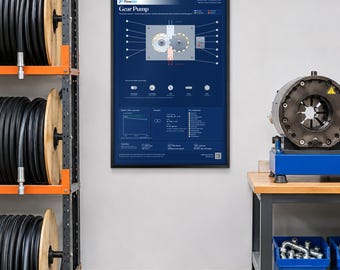


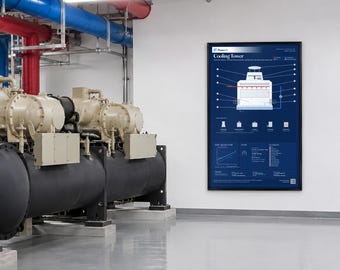
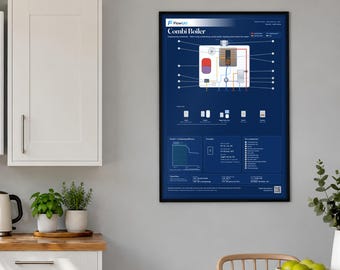


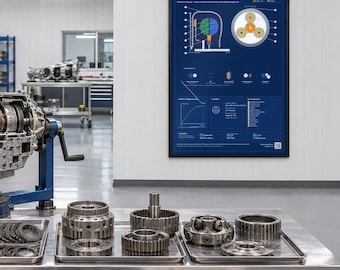
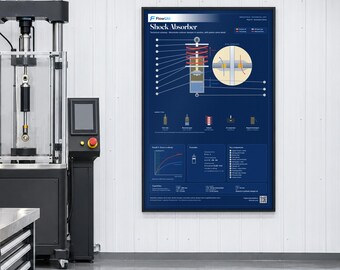
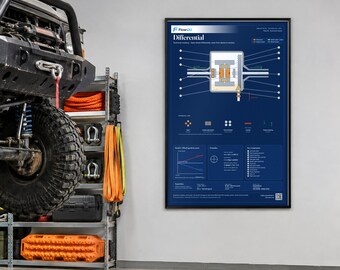


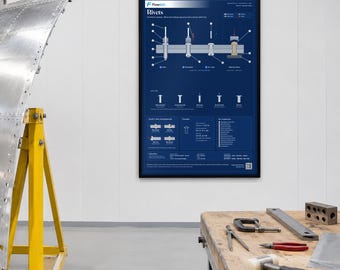
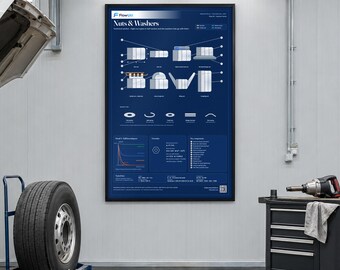

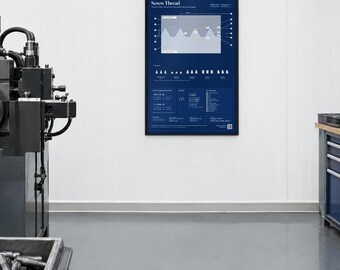
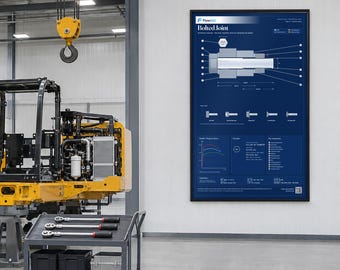
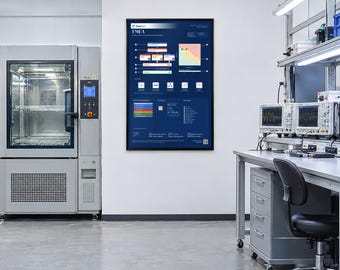

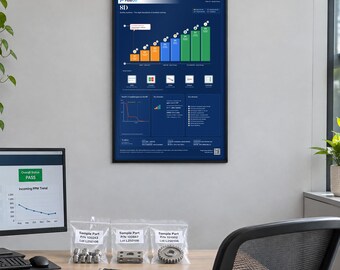

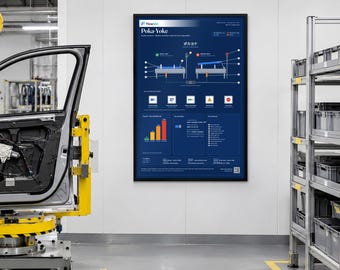


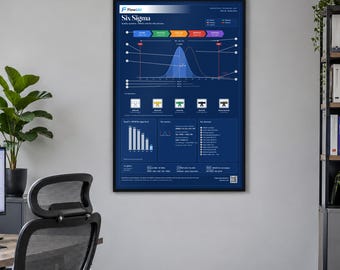
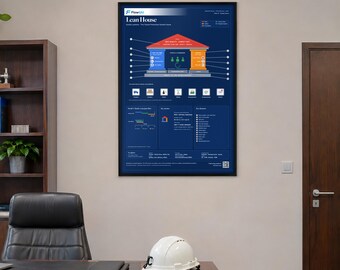

Diagramas de referencia de ingeniería limpios y verificados para el taller, el taller de maquinaria y la oficina.
Clean, verified engineering reference charts for the workshop, the machine shop and the office.
Hola, soy Orçun, la persona detrás de FlowUtil Charts.
Llevo más de 20 años gestionando negocios, y un cuadro de referencia claro y preciso es una de esas herramientas sencillas que ahorran tiempo a diario. Con demasiada frecuencia, el cuadro en la pared está borroso, incompleto o simplemente incorrecto. Quería cuadros de mejor calidad.
FlowUtil Charts surgió de flowutil.com, donde publico calculadoras de ingeniería gratuitas. Los gráficos que se muestran aquí son la versión imprimible del mismo trabajo: un diseño limpio, un tema por gráfico, unidades métricas y pulgadas en la misma página cuando sea conveniente, y un código QR que abre la calculadora correspondiente.
CÓMO SE FABRICA
Cada tabla es diseñada, revisada y publicada por mí. Utilizo herramientas de diseño digital e inteligencia artificial como apoyo para el diseño y la elaboración de planos, del mismo modo que usaría una calculadora o un programa CAD. El trabajo en sí es mío: elijo el contenido de cada tabla y verifico cada valor con respecto a las normas publicadas, los catálogos del fabricante o la fórmula subyacente antes de su publicación. Si dos fuentes discrepan, la tabla muestra el valor más seguro y lo indica.
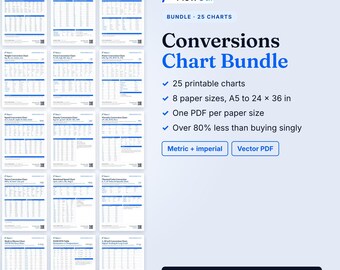
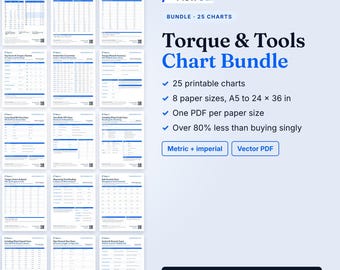
Cada gráfico viene en formato PDF vectorial con 8 tamaños de impresión, desde A5 hasta 24 x 36 pulgadas, listo para imprimir en casa o en una imprenta. Cada sección también está disponible en un paquete de 25 gráficos. ¿Tienes alguna pregunta o te gustaría que existiera algún gráfico en particular? Envíame un mensaje. Los leo todos.
Hi, I'm Orçun, the person behind FlowUtil Charts.
I have spent more than 20 years running businesses, and a clear, correct reference chart is one of those simple tools that saves time every single day. Too often the chart on the wall is faded, incomplete or simply wrong. I wanted better ones.
FlowUtil Charts grew out of flowutil.com, where I publish free engineering calculators. The charts here are the printable side of the same work: one clean design, one topic per chart, metric and inch on the same page wherever it makes sense, and a QR code that opens the matching calculator.
HOW IT'S MADE
Every chart is designed, checked and published by me. I use digital design tools, and AI tools as an assistant for layout and drafting, the same way I would use a calculator or a CAD program. The work itself is mine: I choose what goes on each chart, and every value is checked against published standards, maker catalogues or the underlying formula before the chart goes live. If two sources disagree, the chart shows the safer value and says so.
Each chart comes as vector PDFs in 8 print sizes, from A5 to 24 x 36 in, ready for your home printer or a print shop. Every section is also available as a 25-chart bundle. Questions, or a chart you wish existed? Send me a message. I read every one.

