


NowPrice:€18,12
Original Price: €22,65
20% off
Sale ends on April 1
Python Portfolio Optimization Tool | Efficient Frontier & Sharpe Ratio

- Instant Download
- Your files will be available to download once payment is confirmed. Here's how.
- Instant download items don’t accept returns, exchanges or cancellations. Please contact the seller about any problems with your order.
What to know
About this item
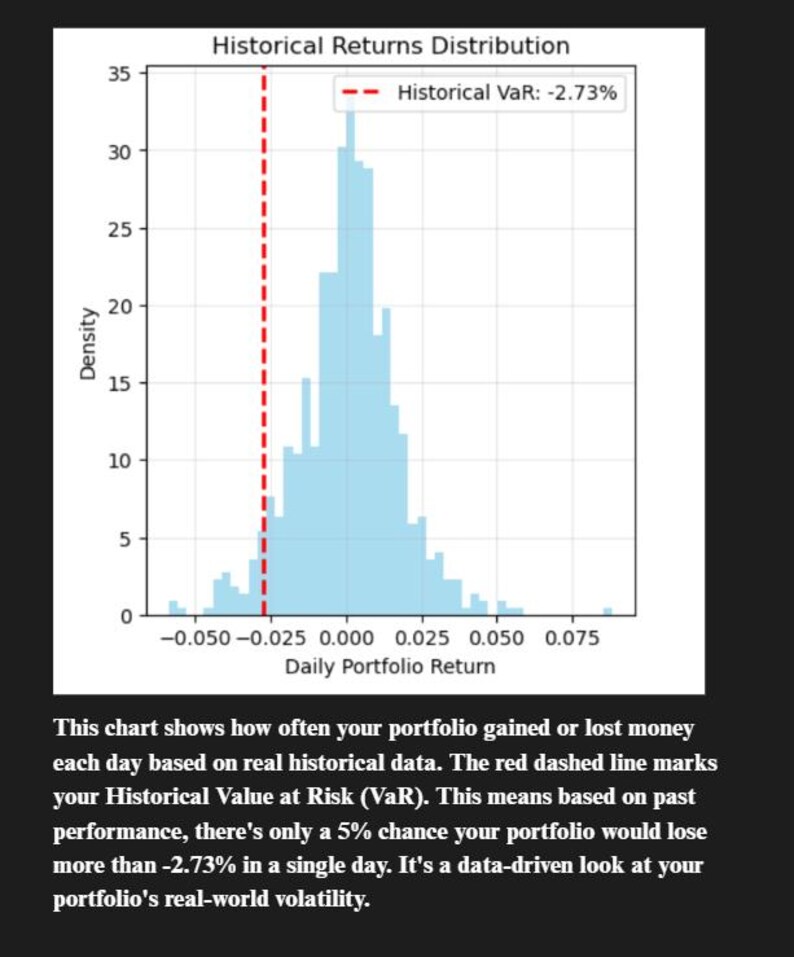
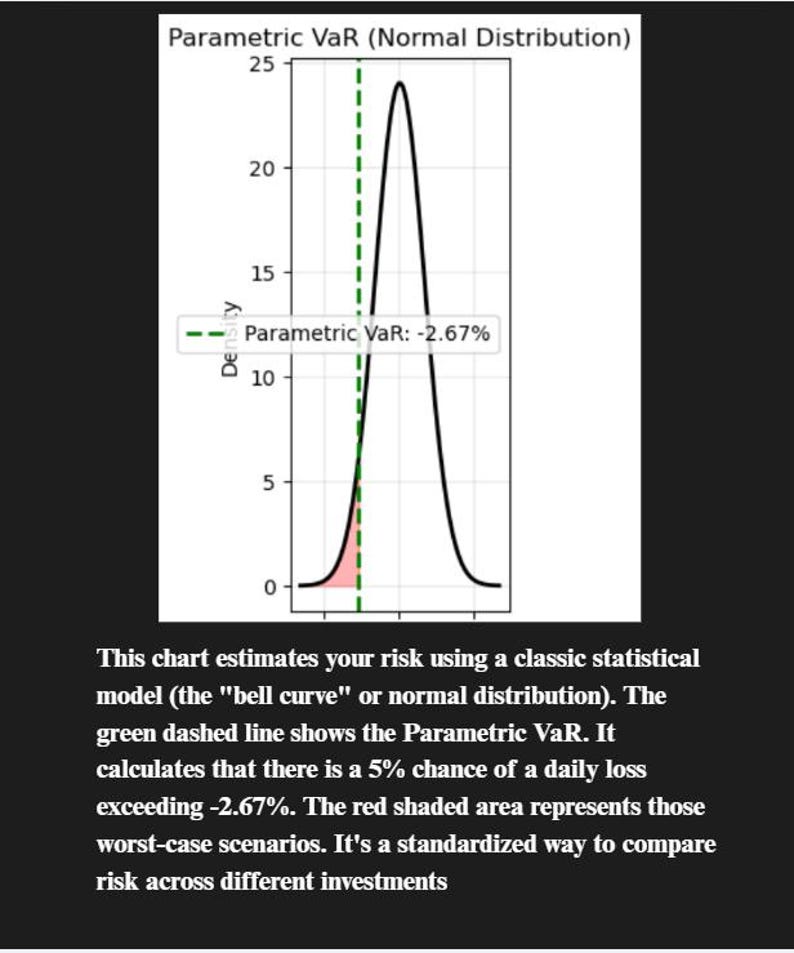
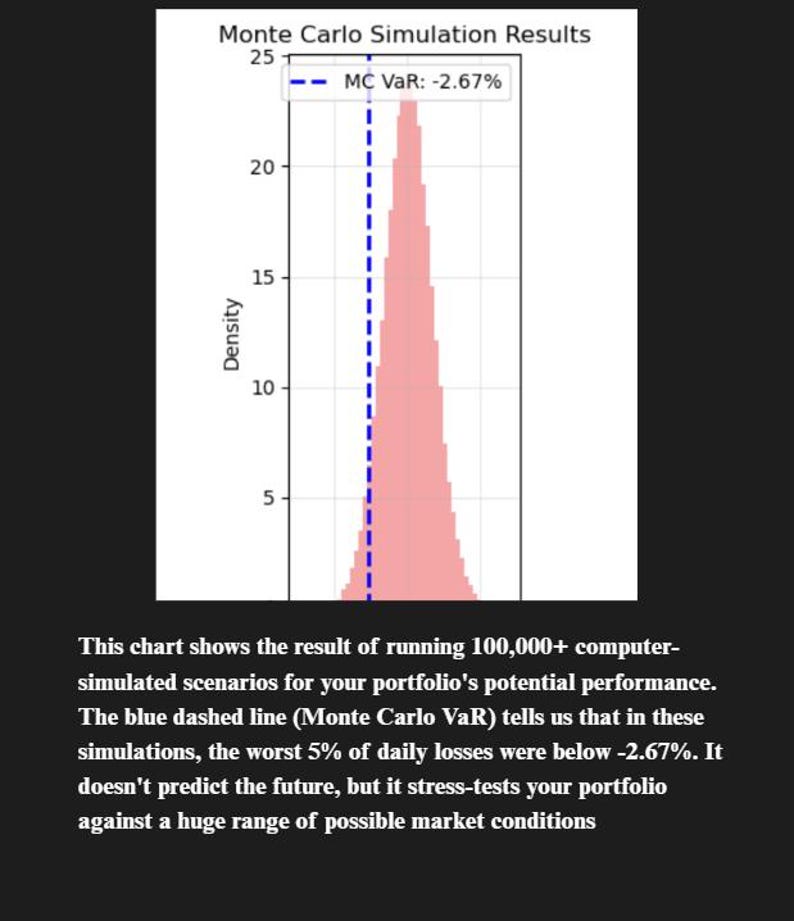
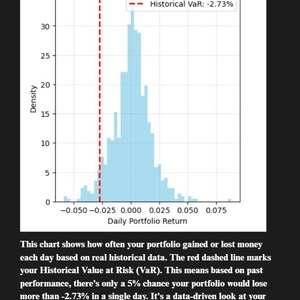
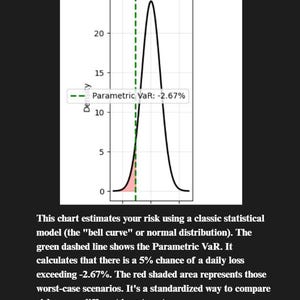
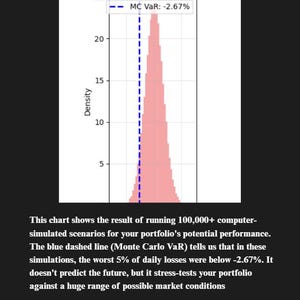
🚀 Automate Your Stock Analysis with Python! This powerful script performs professional-level portfolio optimization, calculating the Efficient Frontier, Sharpe Ratio, and Value at Risk (VaR) to help you build a smarter investment portfolio. Perfect for learning Data Science & Python.
✨ INSTANT DOWNLOAD | 🐍 BEGINNER-FRIENDLY | 📈 PROFESSIONAL TECHNIQUES
What You Get:
A ready-to-run Jupyter Notebook (.ipynb) & Python script.
A step-by-step PDF guide for absolute beginners.
Batch files (*.bat) for one-click installation & execution.
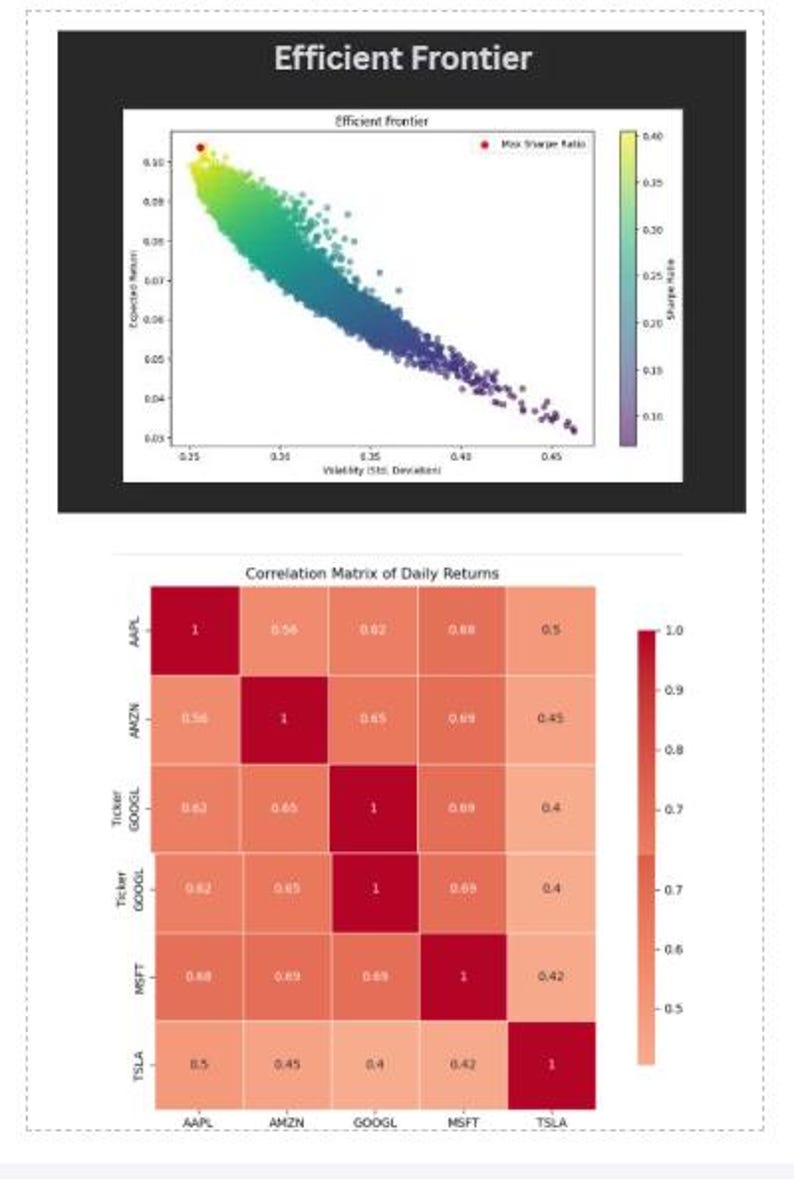
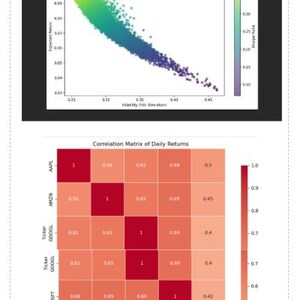
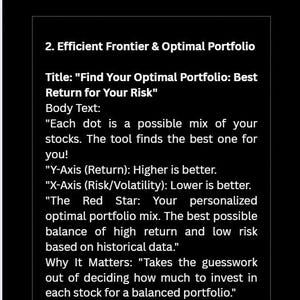
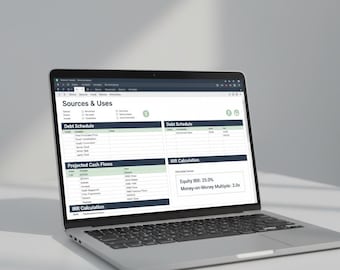
Outputs: Optimal Portfolio Weights, Correlation Heatmap, Efficient Frontier Graph, and Risk Reports.
What It Is NOT:
NOT financial advice. The creator is not a licensed financial advisor.
NOT a prediction tool. It analyzes past data, which does not guarantee future results.
NOT a profit guarantee. All investing involves risk, including loss of principal.
Users are solely responsible for their own investment decisions.
Section 2: Installation Guide
Aimed at absolute beginners, the installation process involves two simple steps:
Install Python: Download the latest version from python.org. Crucially, users must check the "Add Python to PATH" box during installation.
Install Dependencies: Double-click the install_dependencies.bat file. A terminal window will open and install the necessary libraries. The user closes the window once it says "Successfully installed."
Section 3: How To Use The Tool
Add Your Stocks:
Edit the main.py file with a text editor like Notepad or Notepad++.
Locate the line: TICKERS = ['AAPL', 'MSFT', 'GOOGL', 'AMZN', 'TSLA']
Replace the example ticker symbols with your own, keeping the formatting with quotes and commas (e.g., TICKERS = ['NVDA', 'V', 'JPM']).
Save the file.
Run the Analysis:
Double-click the run_analysis.bat file.
A terminal window will open, show a progress bar for downloading data, and print results.
Two graphs will automatically appear and the results will be saved as CSV and PNG files in the folder.
Section 4: Understanding The Results
The tool generates four key outputs:
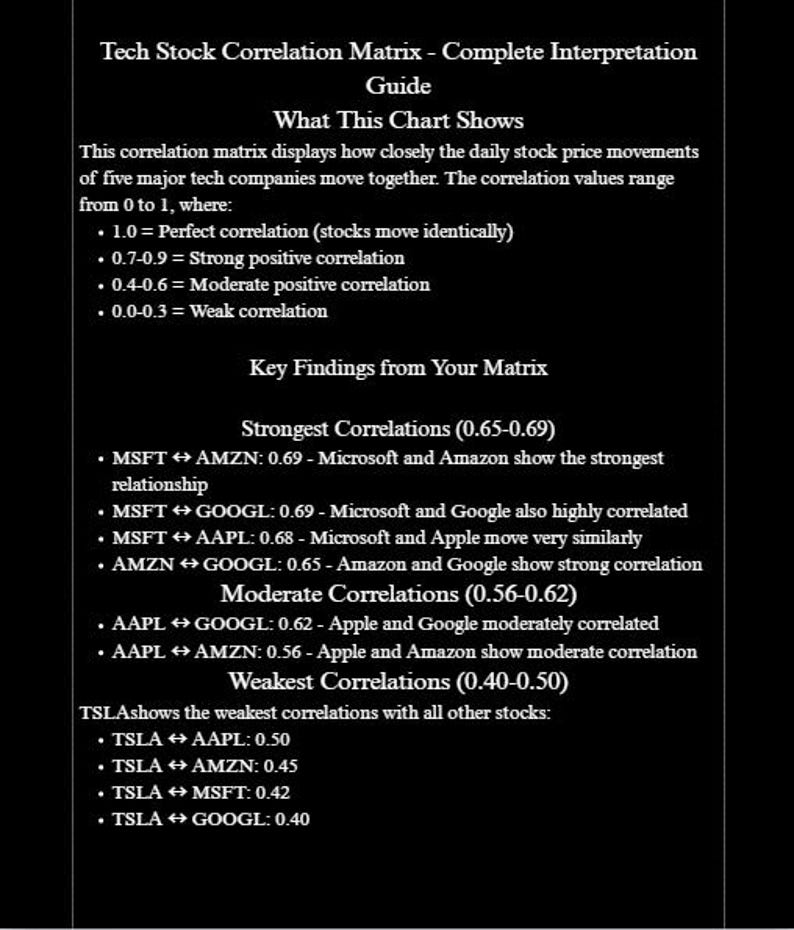
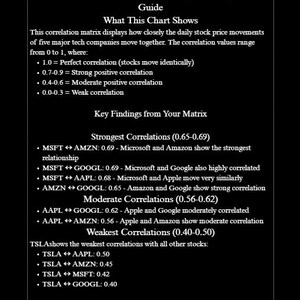
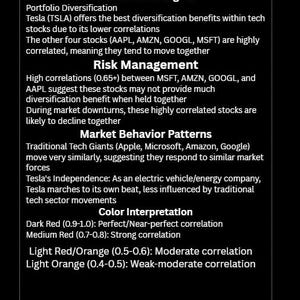
Correlation Heatmap: A chart showing how similarly stocks move together.
Dark Red: Highly correlated (move together).
Dark Blue: Uncorrelated or move opposite (good for diversification
Be the first to review this item
More from this shop
Visit shop-
Digital download
Trial Balance to Financial Statements Excel | Chart of Accounts Mapping Tool for Accountants & Bookkeepers
Sale Price €11,77
Original Price €14,71
-

Digital download
AI Model Regularization for Finance | Prevent Overfitting in Forecast Models
Sale Price €17,22
Original Price €21,52
-

Digital download
AI Data Science Interview Prep Bundle Python Machine Learning FAANG Questions Set
Sale Price €28,07
Original Price €35,09
-
Digital download
Essential LBO Model Excel | Beginner-Friendly Buyout Template with IRR Calculator | Private Equity Analysis
Sale Price €17,20
Original Price €21,50
-

Digital download
Python for Financial Analysis: Investment and Portfolio Management
€7,94
-
Digital download
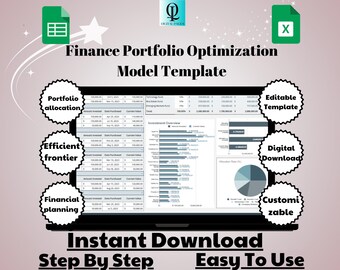
Finance Portfolio Optimization Model Template: Google Sheets Investment Tool (Digital Download)
Sale Price €5,66
Original Price €11,32
-
Digital download
The Handbook of Fixed Income Securities, Ninth Edition.
Sale Price €12,69
Original Price €31,70
-

Digital download
Stock Scan: USA Market
€11,32
-
Digital download
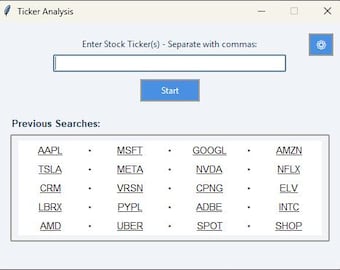
Stock Analysis Tool
€22,64
-

Digital download
Quant Trading Book Bundle: Python, Algos, Options, Forex (PDF Download)
Sale Price €4,98
Original Price €19,93


