


Cena:od 74,98 zł
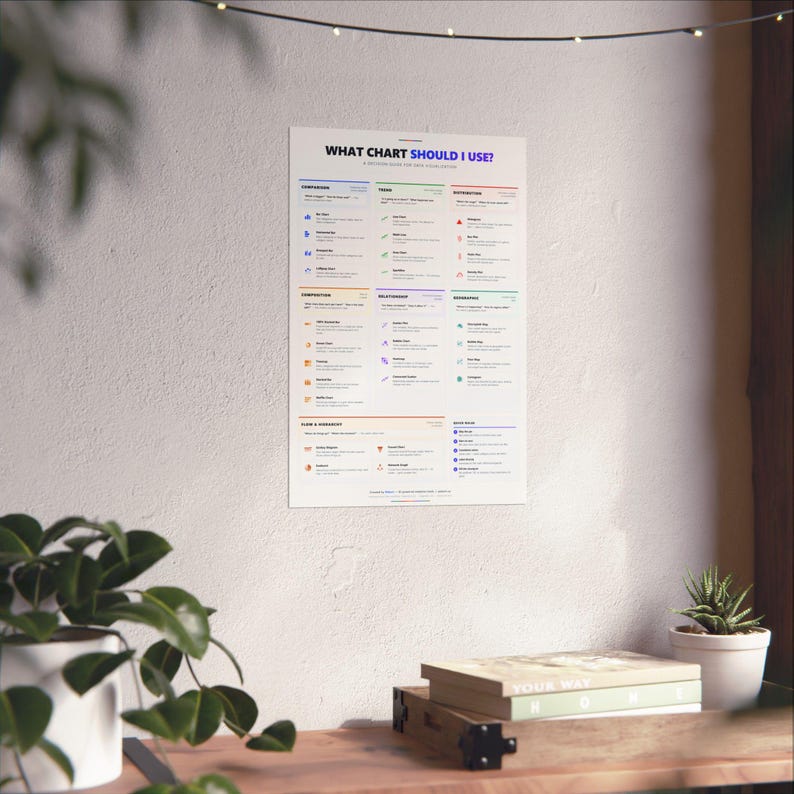
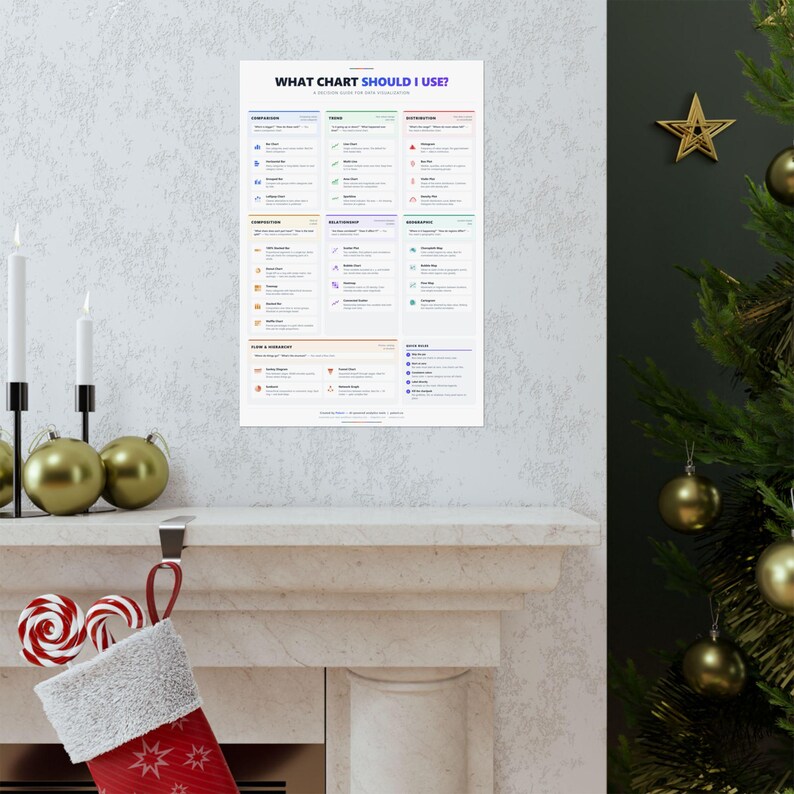
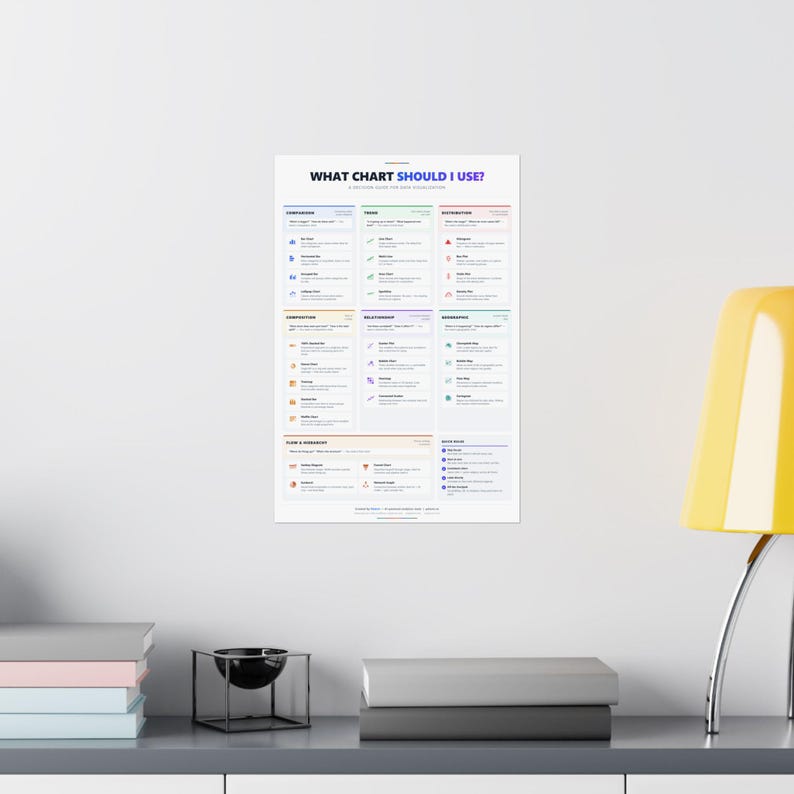
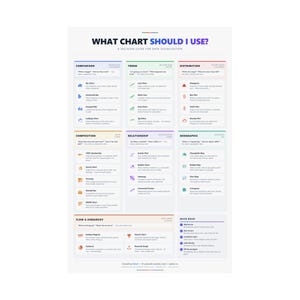
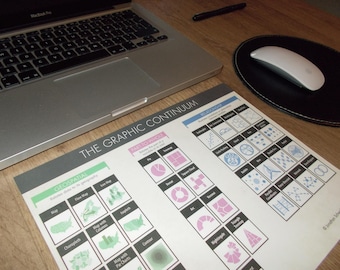
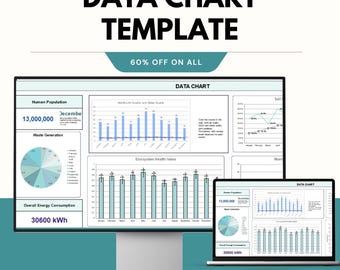
Data Visualization Chart Selection Guide Poster | Analytics Office Wall Art (Printable)
Oto jakie problemy możesz zgłosić:
- Produkt różni się od opisu i zdjęć w ofercie.
- Produkt dotarł uszkodzony.
- Produkt dotarł po szacowanym terminie dostawy.
- Produkt nie dotarł lub został zagubiony w transporcie.
Zwroty i wymiany są akceptowane
Możesz złożyć propozycję ceny tylko przy zakupie pojedynczego produktu
Co wyróżnia produkt
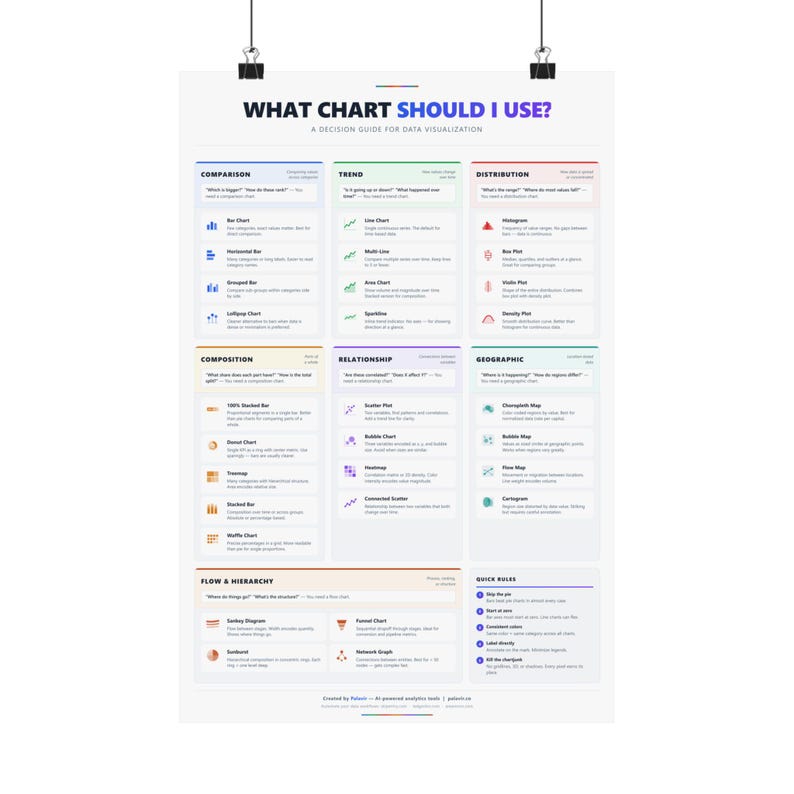
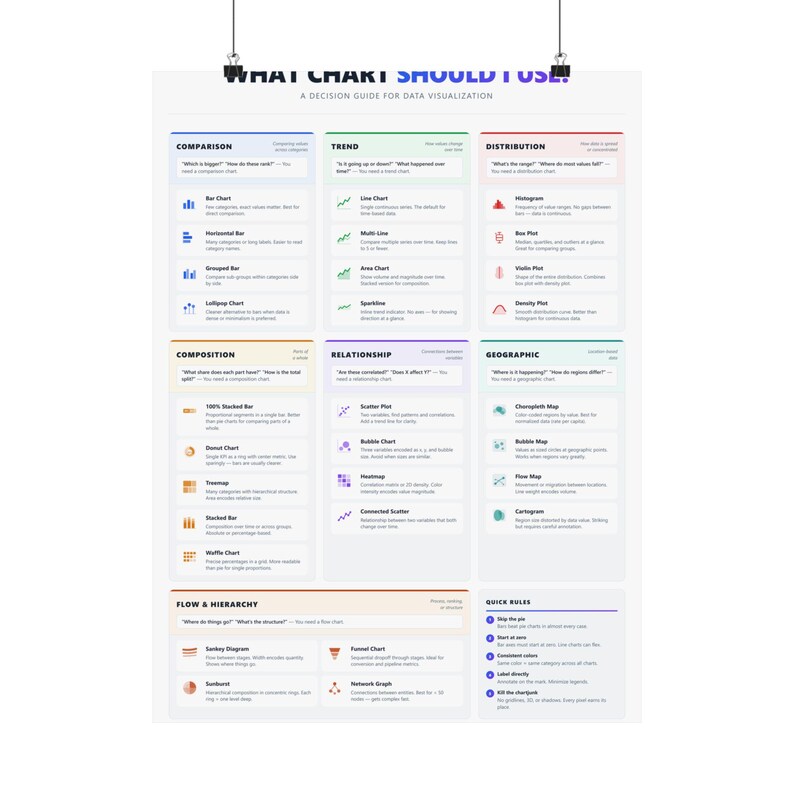
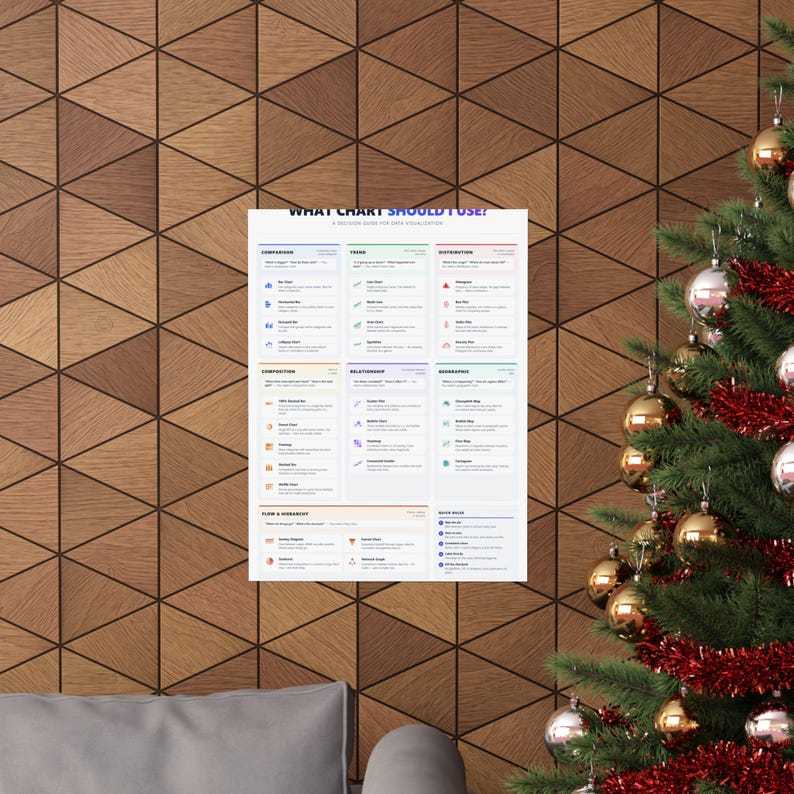
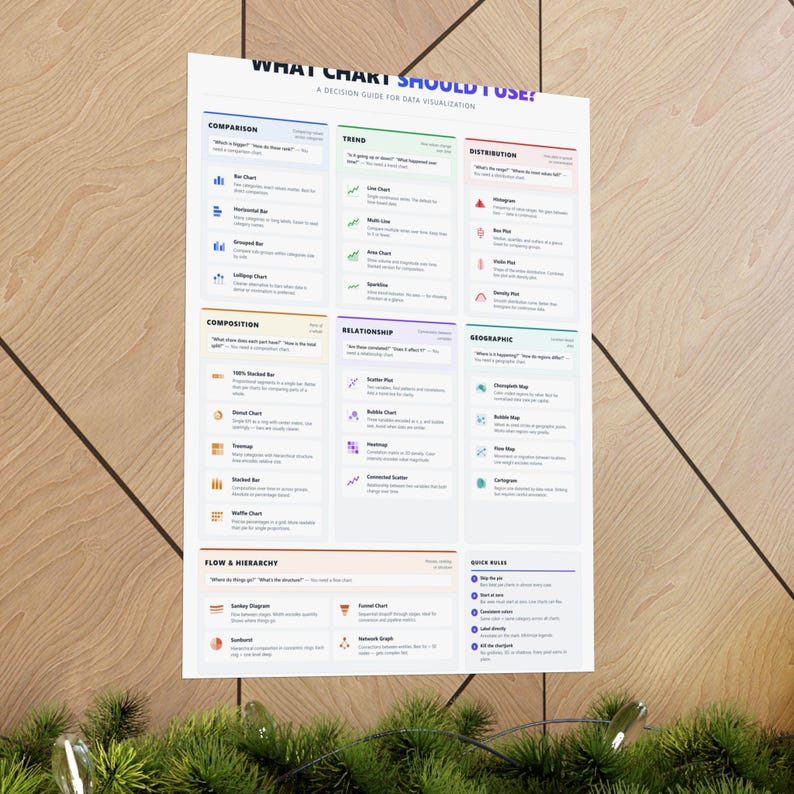
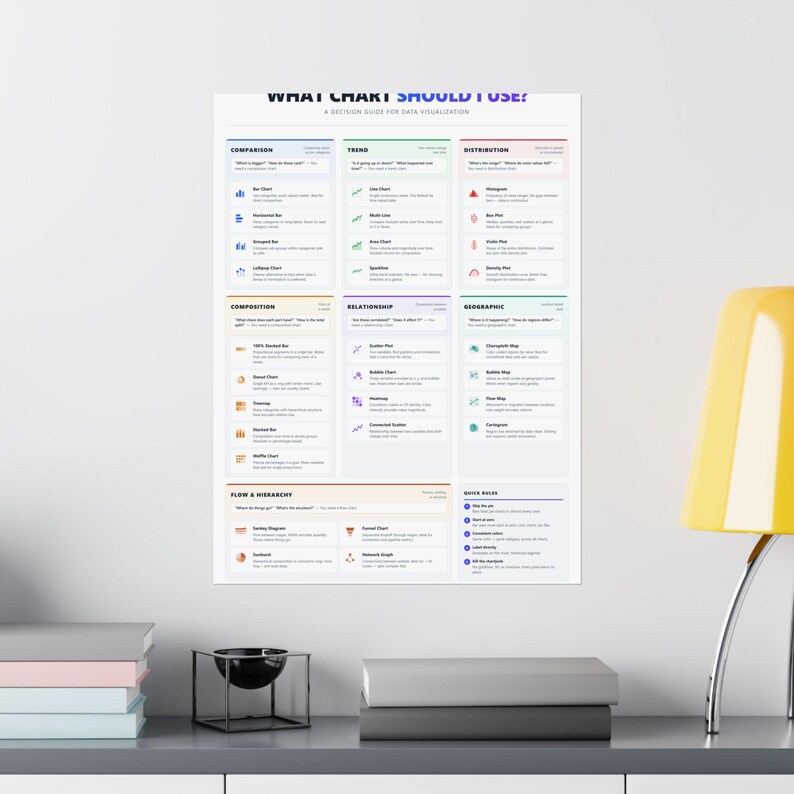
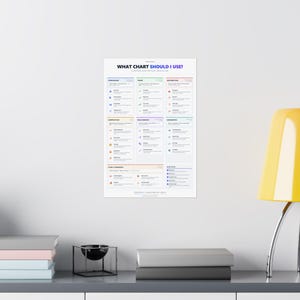
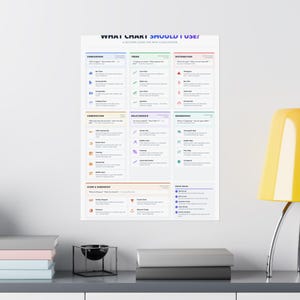
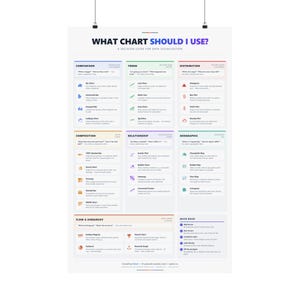
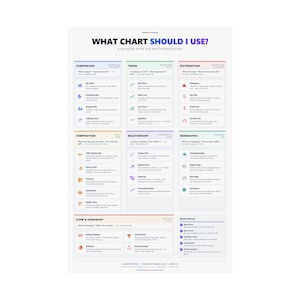
The Chart Selection Guide Poster is the ultimate data visualization quick-reference for analysts, data scientists, students, and anyone who works with charts and graphs. Instantly know which chart type to use for any dataset with this beautifully designed wall poster.
WHAT YOU GET:
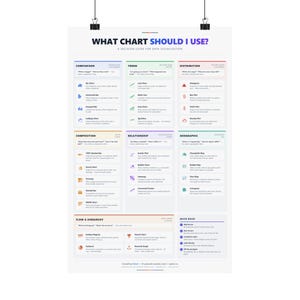
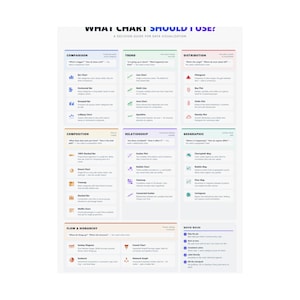
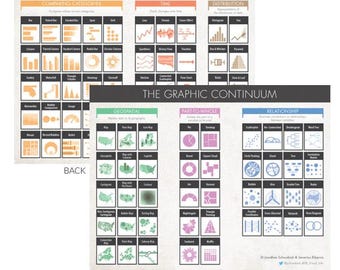
This premium matte poster features a comprehensive visual guide covering all major chart types — bar charts, line graphs, scatter plots, pie charts, histograms, heatmaps, box plots, area charts, and more. Each chart type includes when to use it, what data it works best with, and visual examples so you can make the right choice every time.
WHO IT'S FOR:
• Data analysts and data scientists who present insights daily
• Business intelligence professionals building dashboards and reports
• College and graduate students studying statistics, analytics, or data science
• Product managers and marketers who need clear data storytelling
• Teachers and professors looking for classroom reference materials
• Anyone who wants to level up their data visualization skills
AVAILABLE SIZES:
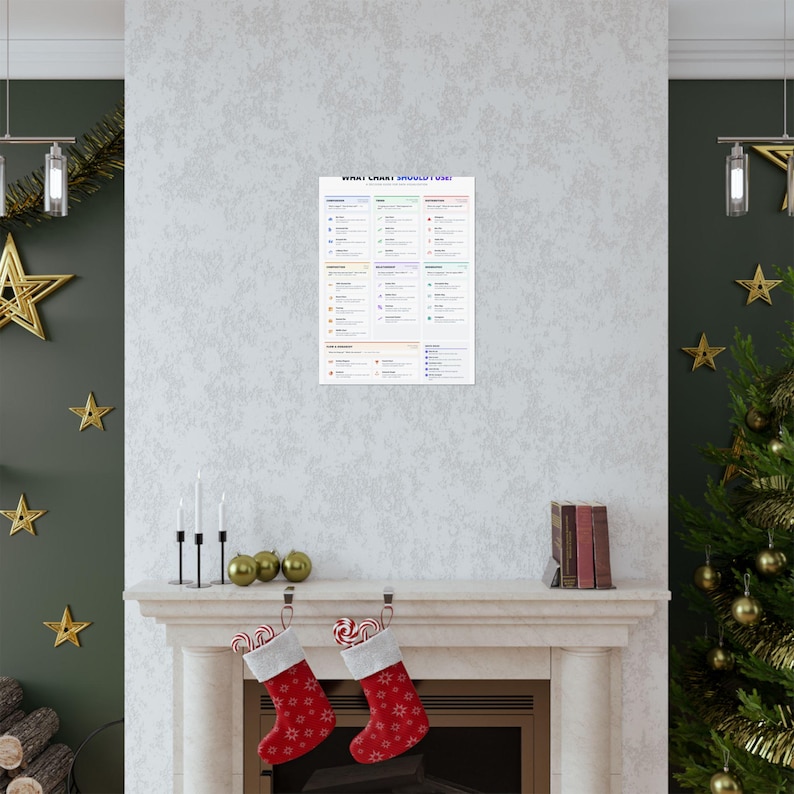
• 12×18 inches — perfect for desk-adjacent wall space or cubicles
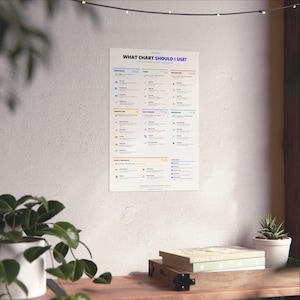
• 20×30 inches — ideal for home offices and dorm rooms
• 24×36 inches — great statement piece for team rooms and classrooms
QUALITY AND DETAILS:
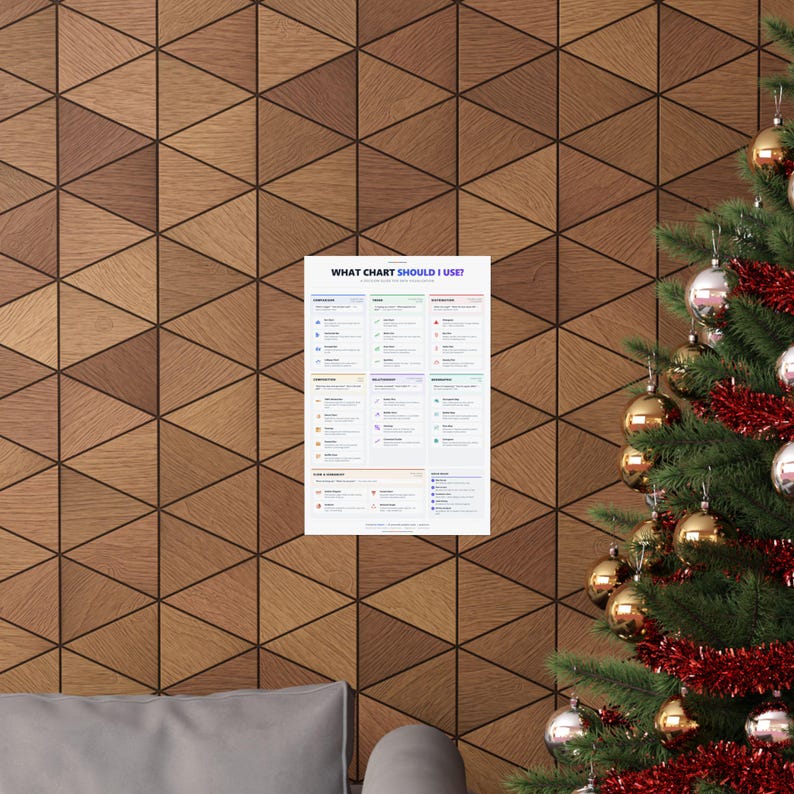
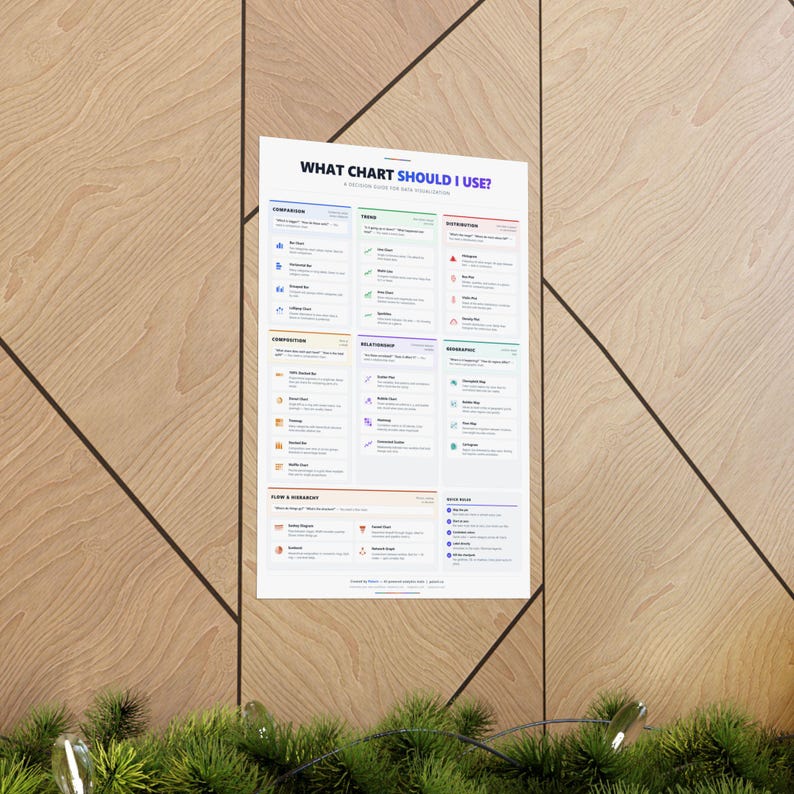
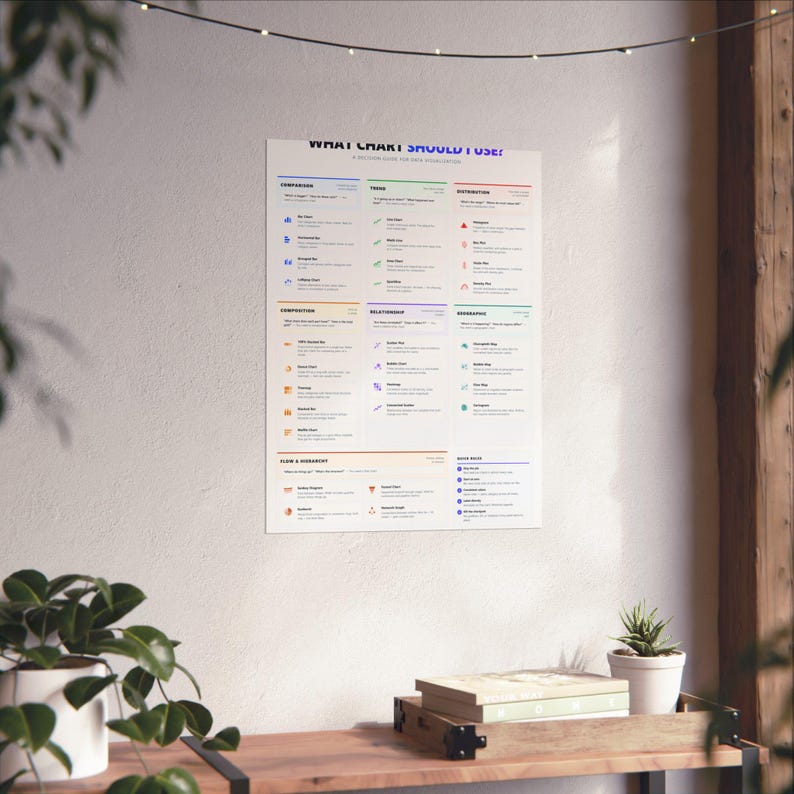
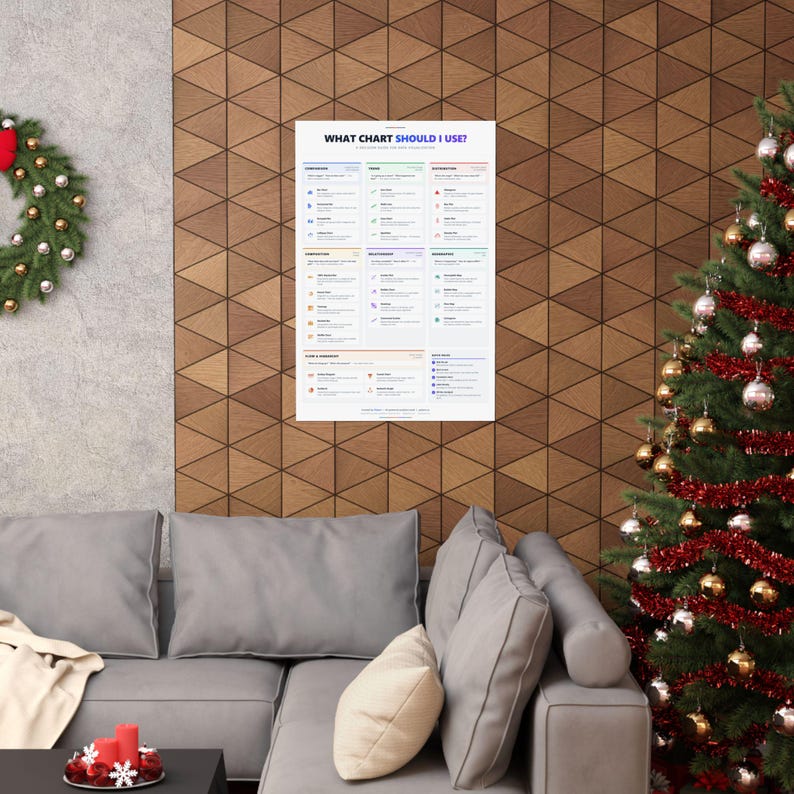
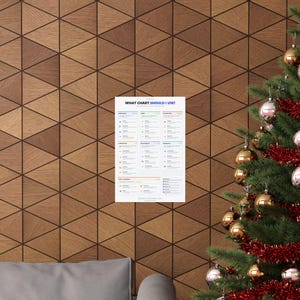
Printed on premium matte paper with vibrant, crisp colors that pop without glare. The matte finish eliminates reflections, making it easy to read from any angle. Shipped flat and ready to frame. Each poster is printed on demand and carefully packaged to arrive in perfect condition.
USE CASES:
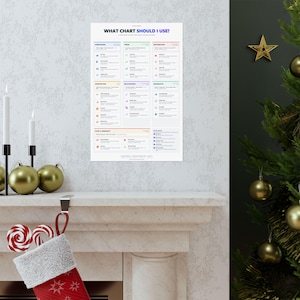
Hang it in your home office for quick reference during data analysis work. Put it in a team room so everyone speaks the same visualization language. Gift it to a data-loving colleague, a CS student, or anyone who geeks out over graphs. It also makes a fantastic teacher appreciation gift or graduation present for analytics and statistics majors.
PERFECT GIFT FOR:
Data nerds, analysts, statisticians, BI developers, dashboard designers, and anyone who has ever asked "which chart should I use?" This poster answers that question beautifully.
---
Browse our full collection of tech reference posters and digital tools at PalavirDigital. Visit findgrants.io for free grant search (46,000+ grants) or skipentry.com for AI invoice processing.
BROWSE OUR DEVELOPER POSTER COLLECTION:
- SQL Commands Reference: search "Palavir SQL Poster"
- Git CLI Cheat Sheet: search "Palavir Git Poster"
- Dashboard Design Patterns: search "Palavir Dashboard Poster"
- Python Cheat Sheet: search "Palavir Python Poster"
-
Wysyłka w ciągu 2–5 dni roboczych
-
Zwroty i wymiany są akceptowane w ciągu 30 dni
Kupujący ponoszą koszty odesłania produktu. Jeśli produkt nie zostanie zwrócony w pierwotnym stanie, kupujący będzie odpowiedzialny za ewentualną utratę wartości.
-
Miejsce nadania: Stany Zjednoczone
Ten produkt nie jest wysyłany do: Polska Skontaktuj się ze sklepem, aby dowiedzieć się więcej o dostępnych opcjach wysyłki.
Wystąpił problem podczas obliczania kosztów wysyłki. Spróbuj ponownie.
Ochrona procesu zakupu na Etsy
Kupuj na Etsy bez obaw – jeśli coś pójdzie nie tak z zamówieniem, możesz na nas liczyć w przypadku wszystkich kwalifikujących się zakupów –
zobacz warunki programu


Więcej produktów z tego sklepu
Odwiedź sklep-
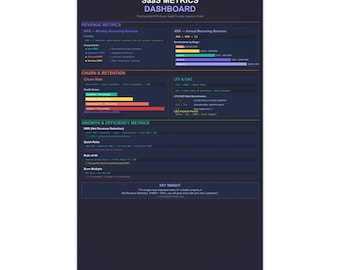
Panel metryk SaaS – plakat referencyjny dla założycieli
76,16 zł
-
Produkt cyfrowy do pobrania
Arkusz kalkulacyjny do śledzenia wniosków o dotacje | Wstępnie załadowane programy, kalendarz terminów (Excel/Arkusze Google)
79,63 zł
-

Produkt cyfrowy do pobrania
Arkusz kalkulacyjny do księgowości praktyki terapeutycznej | Kody CPT, roszczenia, Superbill (Excel, Arkusze Google)
103,10 zł
-
Produkt cyfrowy do pobrania
Planer budżetu dla małych firm | Przepływy pieniężne, wydatki, śledzenie dotacji (Excel, Arkusze Google)
70,25 zł
Wystaw pierwszą opinię
-
Wykresy inteligentniejsze — laminowany przewodnik po wykresach
28,12 zł
-
Produkt cyfrowy do pobrania
Ożyw dane — bezpośrednio na swoim biurku!
14,06 zł
-
Produkt cyfrowy do pobrania
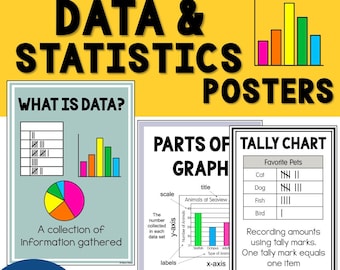
Plakaty z danymi i statystykami - Terminologia matematyczna, definicje i wizualne narzędzia edukacyjne - Wystrój edukacyjny klasy | Słownictwo matematyczne
18,49 zł
-
Produkt cyfrowy do pobrania
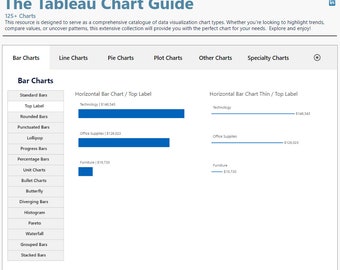
Przewodnik po wykresach Tableau — wykresy, szablony i przewodniki Tableau — ponad 100 typów wykresów
23,43 zł
-
Produkt cyfrowy do pobrania
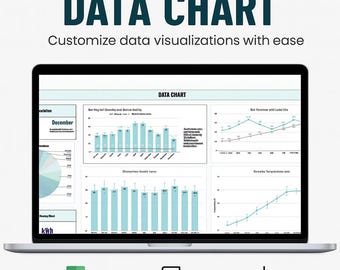
Szablon wykresu danych w programie Excel Arkusze Google Wizualizacja danych Szablon wykresu Wykresy interaktywne Natychmiastowe pobieranie cyfrowe
Cena w promocji 11,70 zł
Pierwotna cena 23,39 zł
-
Produkt cyfrowy do pobrania
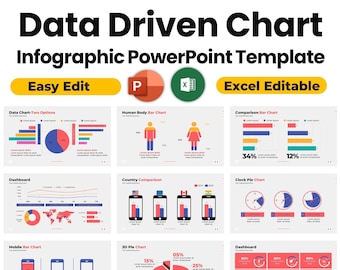
Szablon wykresu i infografiki opartej na danych w programie PowerPoint | Edytowalne dane w programie Excel
23,54 zł
-
Produkt cyfrowy do pobrania
Ponad 200 elementów infografik Apple Pages | Wykresy, pulpity nawigacyjne i szablony danych
Cena w promocji 36,77 zł
Pierwotna cena 73,53 zł
-
Produkt cyfrowy do pobrania
Ponad 20 szablonów wykresów i grafów biznesowych w Excelu i Arkuszach Google | Wizualizacja danych, raporty, pulpity nawigacyjne, prezentacje
Cena w promocji 11,70 zł
Pierwotna cena 46,86 zł
-
Produkt cyfrowy do pobrania
Szablon wykresu słupkowego do wizualizacji danych – Arkusze Google i Excel | Wykresy, diagramy, analizy danych, śledzenie wydajności
Cena w promocji 25,54 zł
Pierwotna cena 51,08 zł
-
Produkt cyfrowy do pobrania
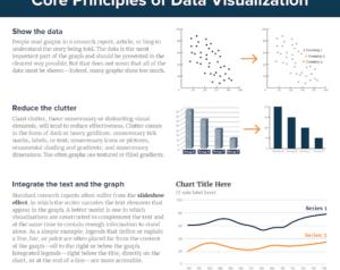
Podstawowe zasady wizualizacji danych – ściągawka
14,06 zł
-
Produkt cyfrowy do pobrania
Szablon wykresu danych – Arkusze Google i Excel | Wizualizacja danych, analizy biznesowe, wskaźniki wydajności
Cena w promocji 25,54 zł
Pierwotna cena 51,08 zł
-
Produkt cyfrowy do pobrania
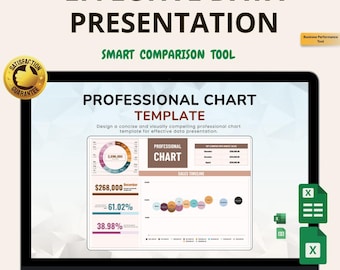
Profesjonalny szablon wykresu: Excel i Arkusze Google (wersja cyfrowa do pobrania, przewodnik w formacie PDF)
Cena w promocji 7,73 zł
Pierwotna cena 30,94 zł
Te produkty podobały się kupującym o podobnym guście
-
Produkt cyfrowy do pobrania
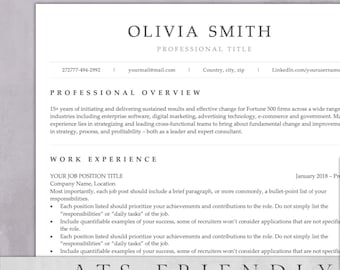
Szablon CV ATS | Nowoczesny, profesjonalny (Word, Pages, Docs)
Cena w promocji 15,19 zł
Pierwotna cena 50,67 zł
-
Produkt cyfrowy do pobrania
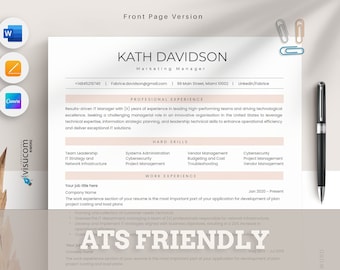
Szablon CV ATS Word, Pages, Canva, Szablon CV ATS, Profesjonalne CV ATS, Nowoczesne CV dla kadry kierowniczej, Minimalistyczne, proste i czyste CV
21,80 zł
-
Produkt cyfrowy do pobrania
Kreatywny, zgodny z ATS wzór CV Profesjonalne CV Canva Proste, minimalistyczne, funkcjonalne Curriculum Vitae Czysty format List motywacyjny
Cena w promocji 6,47 zł
Pierwotna cena 18,48 zł
-
Produkt cyfrowy do pobrania
Szablon CV przyjazny dla ATS, Word, Pages, Dokumenty Google, CV ATS, Szablon CV ATS, Minimalistyczne CV, Proste CV, Podstawowe CV
37,26 zł
-
Produkt cyfrowy do pobrania
Resume CV Templates for Google Docs, Word, Apple Pages | 1 2 3 Page Professional Resume Designs, Cover Letter, Modern CV Curriculum Vitae
30,46 zł
-
Produkt cyfrowy do pobrania
Szablon CV dla grafików i osób kreatywnych | Minimalistyczny szwajcarski projekt (edytowalny w Canva)
54,14 zł
-
Produkt cyfrowy do pobrania
Papier kratkowany do druku, papier w kratkę, wkładki do planera, format A4/A5/Letter/Połowa, natychmiastowe pobranie pliku PDF
Cena w promocji 6,87 zł
Pierwotna cena 9,79 zł
-
Produkt cyfrowy do pobrania
Papier milimetrowy do druku (70x100) - PDF - Szablon do haftu krzyżykowego - Format A4 - Przejrzysty i wygodny - Zaprojektuj własny wzór - Narzędzie Xstitch
4,08 zł
-
Produkt cyfrowy do pobrania
Perfectly Scaled and Precise Printable Graph Paper - 1/5 Inch (5/5 - 5 Lines Per Inch)
4,69 zł
-

Produkt cyfrowy do pobrania
Papier milimetrowy PDF, do druku
4,23 zł
-
Produkt cyfrowy do pobrania
Zestaw papieru milimetrowego, papier milimetrowy do druku, papier w kratkę, szablon cyfrowy dla Goodnotes, Notability, iPad, Android, mała siatka, duża siatka
Cena w promocji 7,35 zł
Pierwotna cena 14,71 zł
-
Produkt cyfrowy do pobrania
Kolorowy papier milimetrowy, arkusze notatek do druku, cyfrowy plik PDF, format US Letter A4 A5
Cena w promocji 2,82 zł
Pierwotna cena 4,69 zł

