


Price:$10.47
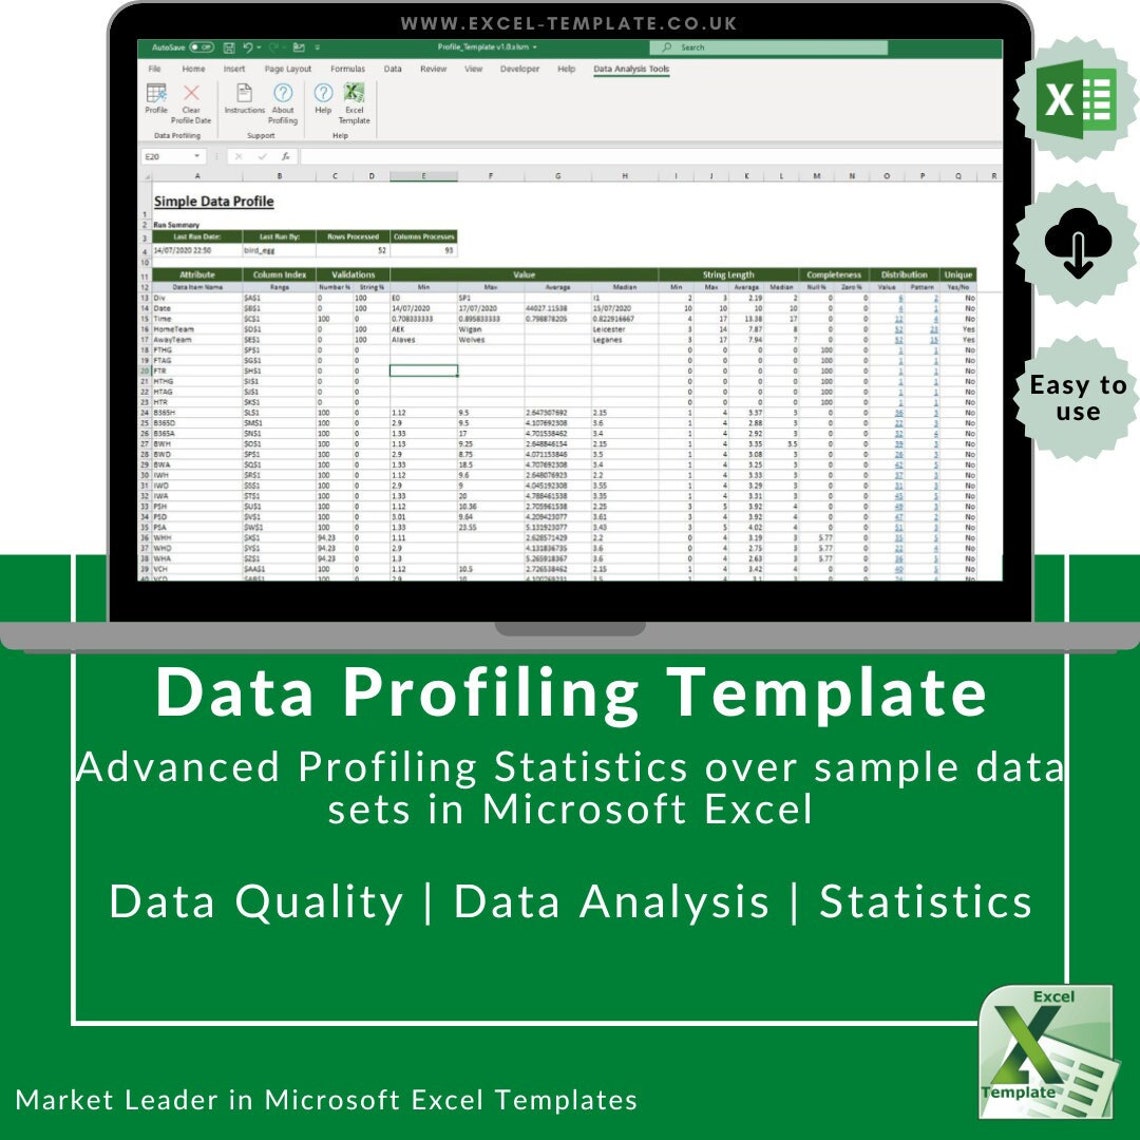
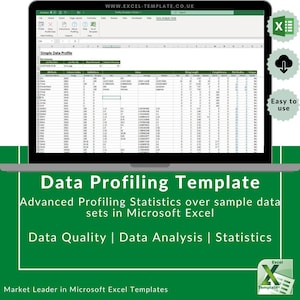
Simple Data Profiling Spreadsheet, Analysis, Data Quality, Stats, Microsoft Excel
You can only make an offer when buying a single item
Highlights
Microsoft Excel Simple Data Profiling Spreadsheet
As an advanced and highly experienced Microsoft Excel user, I have put together this easy to use universal and simple column Data Profiling Spreadsheet.
You might be asking what is Data Profiling and how can this help me? Keep reading below and feel free to ask me any questions.
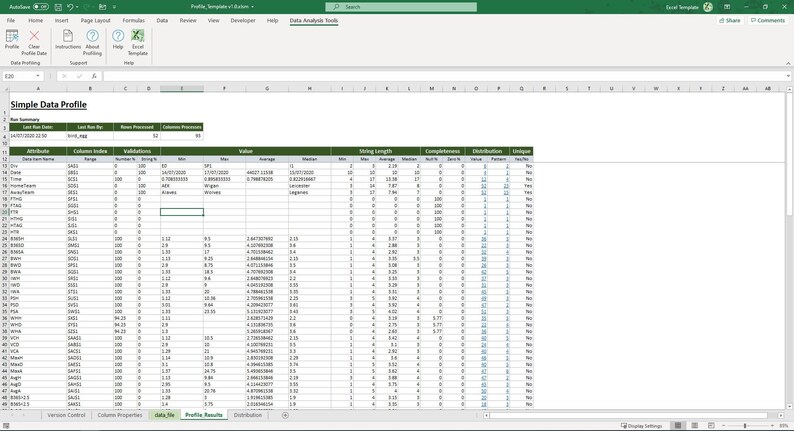
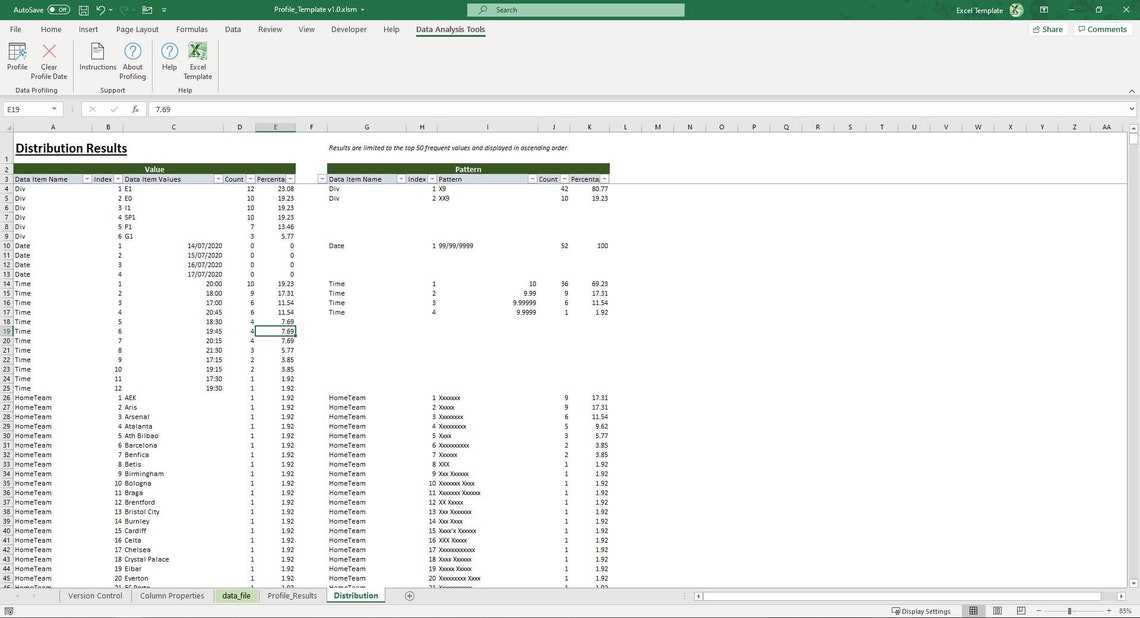
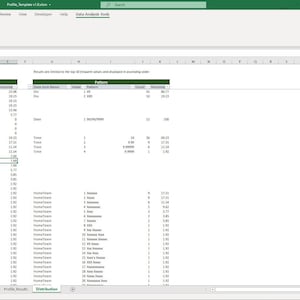
This template provides you with column Data Profiling. A column profile determines the characteristics of columns in a data source, such as value frequency, percentages, and patterns.
Column Profiling discovers the following facts about data:
> The number of: null, zero, number and string values in each column, expressed as a percentage.
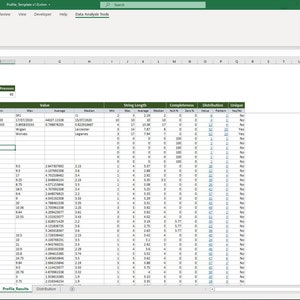
> Statistics about string lengths and: min, max, average and median.
> Statistics about each column values, such as min, max, average and median.
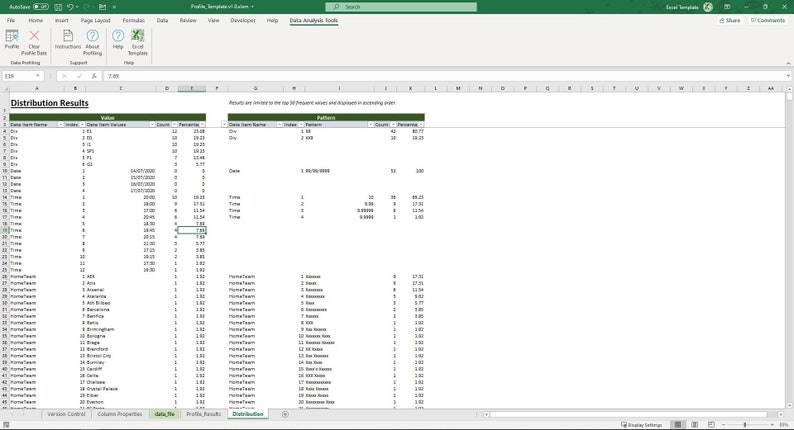
> Patterns of data in each column and the frequencies with which these values occur.
The purpose of these statistics may be to:
1) Find out whether existing data can be easily used for other purposes
2) Improve the ability to search data by tagging it with keywords, descriptions, or assigning it to a category
3) Assess data quality, including whether the data conforms to particular standards or patterns
4) Assess the risk involved in integrating data in new applications, including the challenges of joins
5) Discover metadata of the source database, including value patterns and distributions, key candidates, foreign-key candidates, and functional dependencies
6) Assess whether known metadata accurately describes the actual values in the source database
7) Understanding data challenges early in any data intensive project, so that late project surprises are avoided. Finding data problems late in the project can lead to delays and cost overruns
8) Have an enterprise view of all data, for uses such as master data management, where key data is needed, or data governance for improving data quality.
This template has been developed and tested in Windows Microsoft Excel 2016 and will work from Excel 2010 onwards.
All the contents is in English.
Workbook Contents
To summaries you will be receiving:
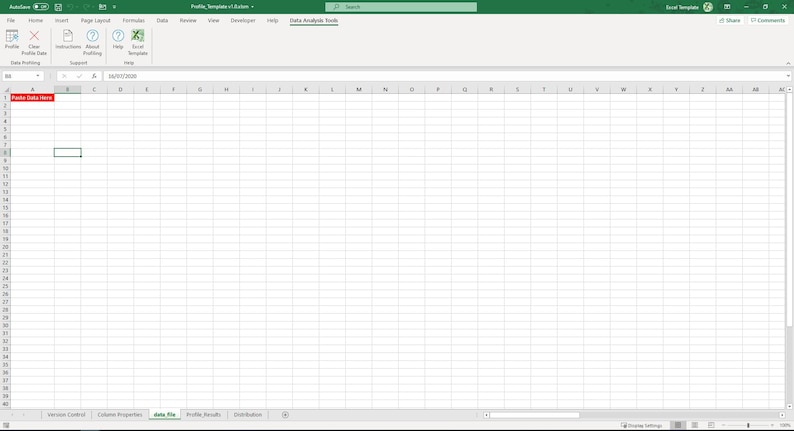
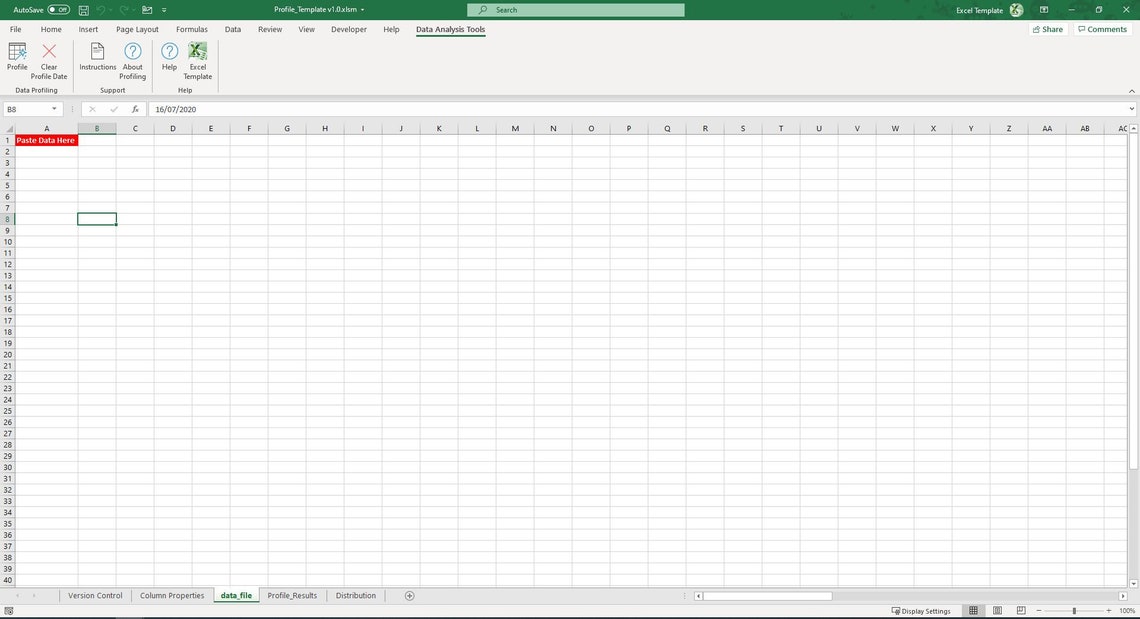
1) Easy to use and simple column Data Profiling spreadsheet.
2) Can be used over and over again for multiple data sets.
3) Custom ribbon controls
4) Free version updates
5) Help and Support
6) For use with small datasets (approx 50,000 rows and 200 columns max) due to the processing time it will take to run
SYSTEM REQUIREMENTS
IMPORTANT: You will need a Laptop/PC running a Windows operating system and a full version of Microsoft Excel 2007 onward installed to use this spreadsheet. This will not run using Open Office or Mac for example.
Version Policy
All new versions are FREE.
All major versions (whole number) are sent out once developed and tested.
Instant Download
Your files will be available to download once payment is confirmed. Here's how.
Instant download items don’t accept returns, exchanges or cancellations. Please contact the seller about any problems with your order.
Etsy Purchase Protection
Shop confidently on Etsy knowing if something goes wrong with an order, we've got your back for all eligible purchases —
see program terms

Reviews for this item (1)

Redoing my review as I spent more time working with the spreadsheet figuring out how to make it function correctly. And actually, it looks like it will work nicely with historical lottery data finding possible patterns and what numbers appear more often.

More from this shop
Visit shop-
Digital download
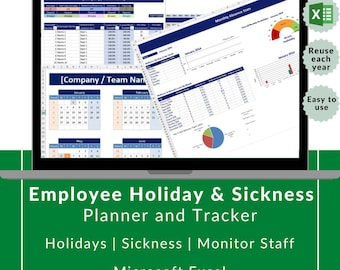
Employee Holiday & Sickness Planner, Reusable Excel Template
$4.19
-
Digital download
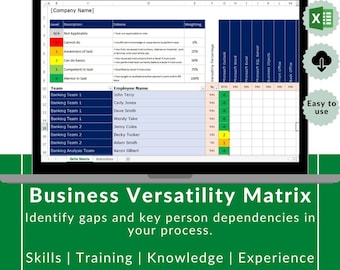
Employee, Staff, Office / Skills, Versatility Matrix, Training, Knowledge, Experience tracker Microsoft Excel Spreadsheet
$2.09
-
Digital download
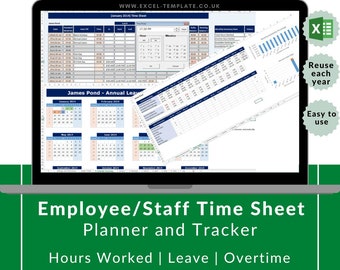
Employee, Staff Time Sheet and Calendar reusable, Microsoft Excel Spreadsheet
$4.19
-
Digital download
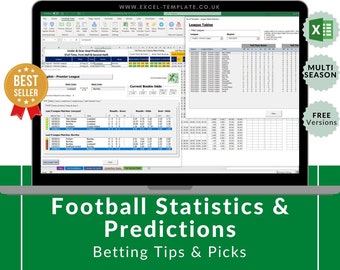
Football, Soccer Betting Odds Statistics. Fully automated results. Tips / Picks
$41.88
-
Digital download
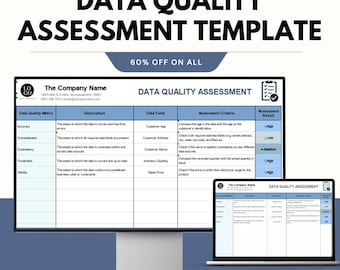
Data Quality Assessment Template - Google & Excel Sheets | Data Integrity, Quality Monitoring, Performance Analysis
Sale Price $5.65
Original Price $11.31
-
Digital download
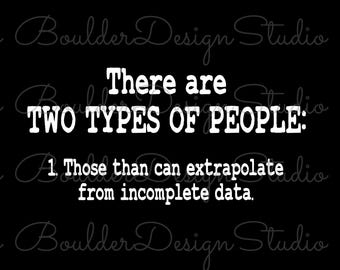
There Are Two Types Of People 1 Those Than Can Extrapolate From Incomplete Data PNG | Digital Instant Download Only
$2.49
-
Digital download
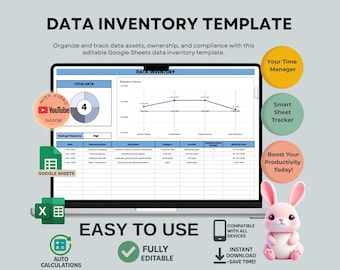
Data Inventory Template for Data Management, Editable Google Sheets, Digital Download
Sale Price $5.99
Original Price $11.98
-
Digital download
Data SVG and PNG. Perfect for Data Analysts, Data Scientists, Accountants, and Data Nerds. Because data or it didn't happen!
Sale Price $3.73
Original Price $4.97
-
Digital download
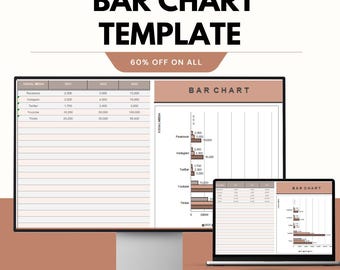
Bar Chart Template: Google & Excel Sheets for Visual Data Analysis and Tracking
Sale Price $5.65
Original Price $11.31
-

Digital download
Data Scientist Definition Print – Funny Gift for Data Analysts or Data Engineers – Wall Art & Cards (Digital Download, Commercial Use)
Sale Price $4.49
Original Price $5.99


