


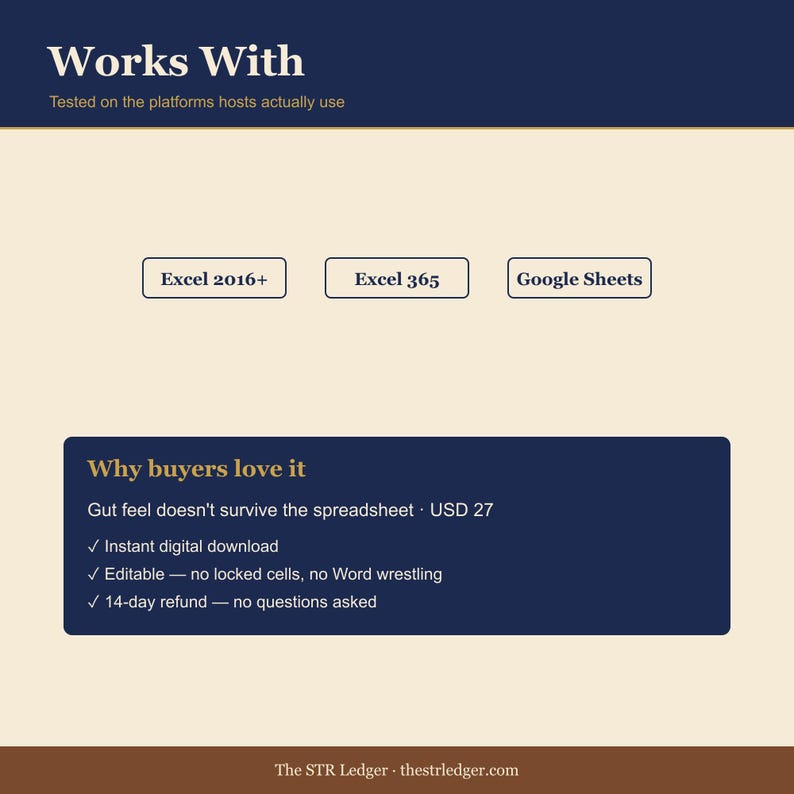


Price:$27.00
Year-Over-Year STR P&L Comparison — Airbnb YoY Performance Spreadsheet — Top Mover Analysis — Excel + Sheets
Here's what's eligible:
- Your order doesn't match the item description or photos
- Your item arrived damaged
- Your item arrived after the estimated arrival window
- Your item didn't arrive or was lost in the mail
You can only make an offer when buying a single item
Highlights
Did 2026 actually go better than 2025 — or did it just feel that way? Year-over-year P&L comparison spreadsheet for Airbnb / STR hosts. Top-3 favorable + top-3 unfavorable movers per property. Excel + Google Sheets.
Every January you tell yourself last year was "fine." But — was revenue actually
up? Did expenses creep? Was occupancy flat-but-rate-was-up, or did rate drop and
occupancy compensate? Without a side-by-side, gut feel doesn't survive the spreadsheet.
This workbook is the year-end answer machine. Per-property YoY revenue, expenses,
NOI, occupancy. $ delta and % delta per category. Top-3 favorable movers (the
categories that improved most). Top-3 unfavorable (your action items for next year).
═══════════════════════════════════════════
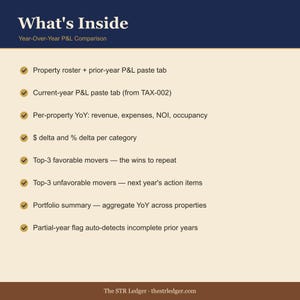
WHAT'S INCLUDED
═══════════════════════════════════════════
📋 Property Roster
📋 Prior Year tab — paste prior-year P&L (typically from TAX-002)
📋 Current Year tab — paste current-year P&L
📋 Per-Property YoY — revenue, expenses, NOI, occupancy: current vs prior, $ delta, % delta
📋 Top-3 Favorable Movers — the wins to repeat
📋 Top-3 Unfavorable Movers — next year's optimization queue
📋 Portfolio Summary — aggregate YoY across all properties
📋 Partial-Year Flag — auto-detects properties with partial prior years (don't draw bad conclusions)
═══════════════════════════════════════════
COMMON PATTERNS
═══════════════════════════════════════════
· Revenue ↑ + occupancy ↓ = pricing power gained, push harder next year
· Revenue flat + occupancy ↑ = comp set raising rates faster than you (run REV-003)
· Cleaning expense ↑ 20%+ = renegotiate or replace cleaner (run OPS-004)
· Insurance ↑ = shop carriers
· Net income ↓ but YoY revenue ↑ = expense creep — find the categories on the Top-3 Unfavorable
═══════════════════════════════════════════
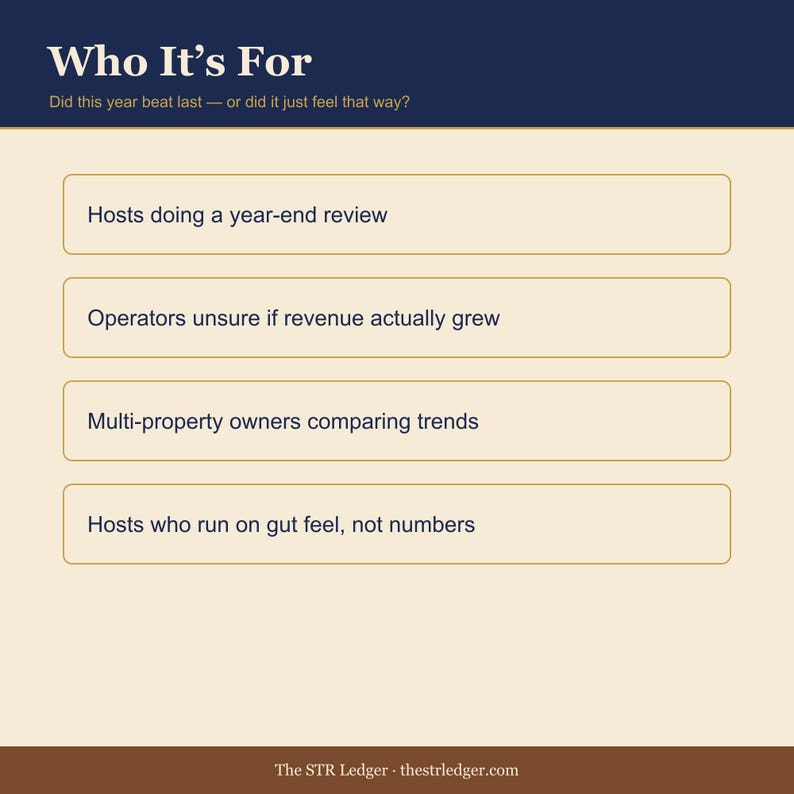
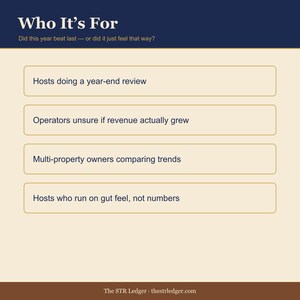
WHO THIS IS FOR
═══════════════════════════════════════════
· STR hosts entering year 2+ of operation
· Multi-property operators wanting per-property YoY breakdowns
· DIY filers reconciling pre-CPA-handoff
· Anyone who's said "I think things were better/worse this year" without numbers
═══════════════════════════════════════════
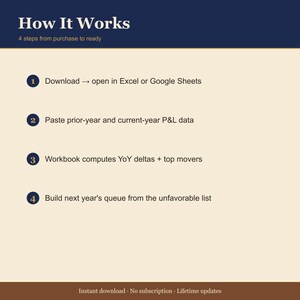
HOW IT WORKS
═══════════════════════════════════════════
1. Run in early January with full prior + current-year data.
2. Open Top-3 Movers. The unfavorable list = action items.
3. Match each action item to a tool: REV-002 (pricing), OPS-004 (cleaning), etc.
═══════════════════════════════════════════
FILE COMPATIBILITY
═══════════════════════════════════════════
✅ Excel 2016+ (Windows + Mac) · ✅ Excel 365 · ✅ Google Sheets
═══════════════════════════════════════════
REFUNDS
═══════════════════════════════════════════
14-day refund, no questions asked. hello [!at] thestrledger.com.
═══════════════════════════════════════════
⚠ Digital product. Compare like-to-like (full-year vs full-year).
Instant Download
Your files will be available to download once payment is confirmed. Here's how.
Instant download items don’t accept returns, exchanges or cancellations. Please contact the seller about any problems with your order.
Etsy Purchase Protection
Shop confidently on Etsy knowing if something goes wrong with an order, we've got your back for all eligible purchases —
see program terms


More from this shop
Visit shop-

Digital download
Partnership Distribution Tracker for STR LLCs — Capital Account + K-1 Prep Spreadsheet — Excel + Sheets
$47.00
-

Digital download
DSCR Tracker for Airbnb STR Investors — Debt Service Coverage Ratio Calculator — Refinance Eligibility — Excel
$27.00
-

Digital download
5-Year STR Pro Forma Builder — Airbnb IRR + Equity Multiple Calculator — Real Estate Investment Excel
$47.00
-

Digital download
STR License Renewal Calendar — Airbnb Permit Tracker — Vacation Rental Compliance Spreadsheet — Excel
$17.00
Be the first to leave a review
-
Digital download
Short Term Rental Investment Analysis
$2.00
-
Digital download
AirBNB Property Analysis | Income & Expense | Return on Investment | AirBNB Purchase Analysis | Vacation Rental Analysis | Short Term Rental
$5.00
-

Digital download
STR Investor Starter Pack | Airbnb Excel Templates | Portfolio Dashboard, Analyzer, Guest Experience Tracker
$1.99
-
Digital download
Airbnb Short Term Rental All in One Excel Template Vacation Rental Performance Analysis Income Expenses Bookkeeping Profit & Loss Occupancy
$21.97
-
Digital download
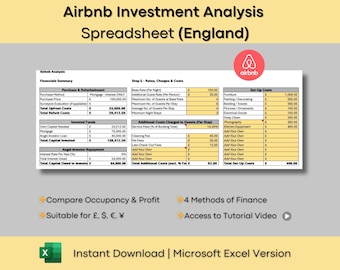
Airbnb Investment Analysis Spreadsheet (England): Excel Template (Digital Download)
$20.80
-
Digital download
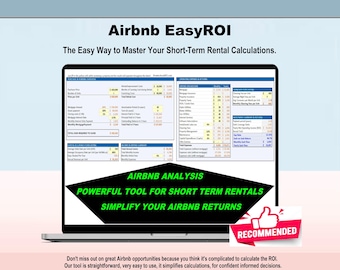
Airbnb EasyROI. Short term rental ROI calculator. Template Spreadsheet Airbnb Host Vacation Rental Property Vrbo (Excel and/or Google Sheet)
Sale Price $25.83
Original Price $36.90
-
Digital download
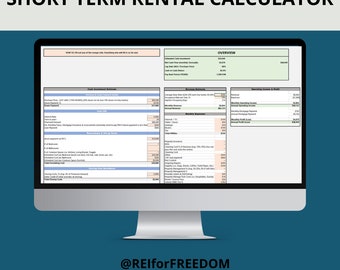
STR/AIRBNB CALCULATOR
$9.99
-
Digital download
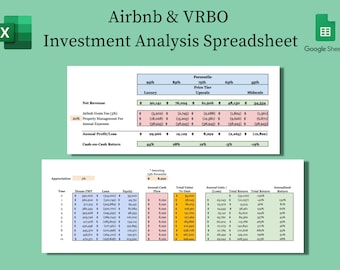
Airbnb & VRBO Investment Analysis Spreadsheet | Excel and Google Sheets | Short Term Rental Return Spreadsheet
$20.00
-
Digital download
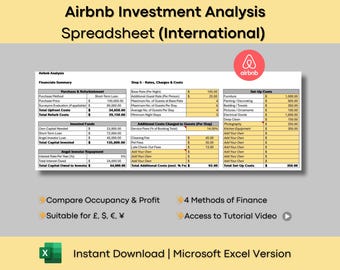
International Airbnb Investment Analysis Spreadsheet in Yellow (Microsoft Excel Version)
$20.80
-
Digital download
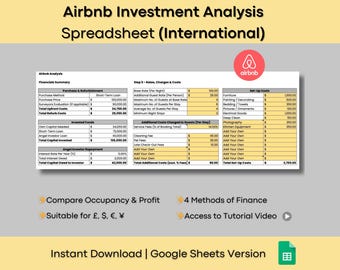
International Airbnb Investment Analysis Spreadsheet - Google Sheets (Digital Download)
$20.80
-
Digital download
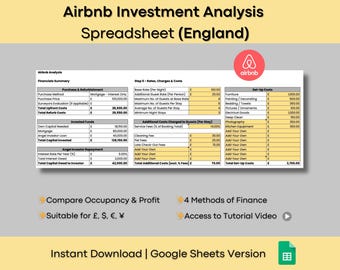
Airbnb Investment Analysis Spreadsheet (England): Google Sheets (Digital Download)
$20.80
-
Digital download
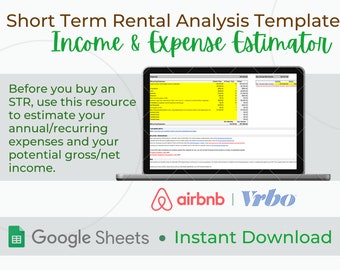
Short-Term Rental Income & Expense Estimator | Single Property Analysis | AIRBNB/VRBO Vacation Rental Data | Editable Google Sheets Template
$20.00
Shoppers with similar taste loved these
-
Digital download
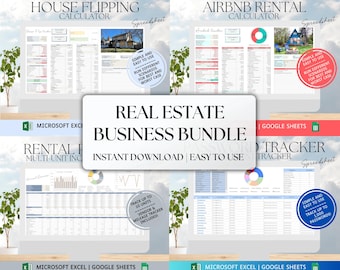
Real Estate Business Spreadsheet Bundle: House Flip Airbnb Calculator Bookkeeping Password Tracker Excel & Google Sheets Digital Download
$34.97
-
Digital download
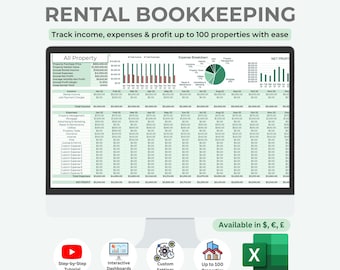
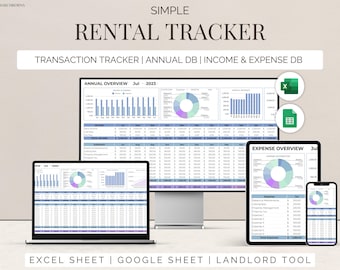
Rental Property Bookkeeping Excel Spreadsheet | Multi-Property Income & Expense Tracker
$17.69
-
Digital download
Rental Property Bookkeeping Google Sheets Landlord Spreadsheet Multi Property Income and Expense Tracker Excel Tenant Tracker Rent Payment
Sale Price $8.49
Original Price $16.98
-
Digital download
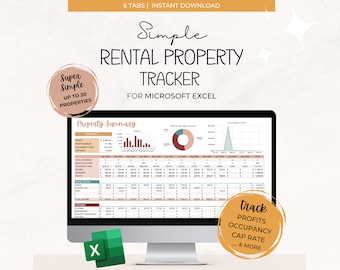
Rental Property Tracker Landlord Spreadsheet Multi Property Income and Expense Excel Google Sheets Rental Bookkeeping Rent Payment Tracker
Sale Price $8.86
Original Price $17.71
-
Digital download
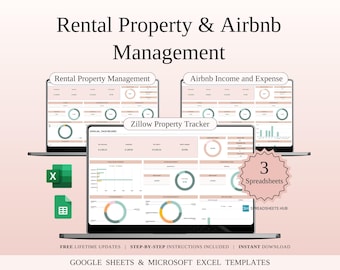
Rental Property & Airbnb Management Toolkit | Excel and Google Sheets | 12 Templates
Sale Price $27.49
Original Price $109.97
-
Digital download
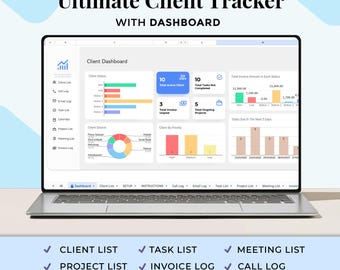
Client Tracker, CRM Dashboard, Google Sheets, Small Business Template, Lead Tracker, Customer Seller Spreadsheet
Sale Price $13.64
Original Price $22.74
-
Digital download
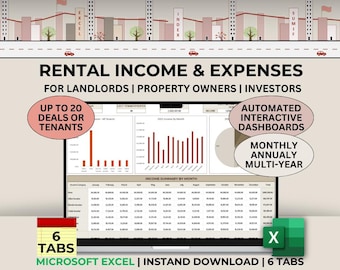
Rental Income and Expense Excel Tracker for Property Management Template for Real Estate Transaction Spreadsheet for Landlord Tenant Tracker
Sale Price $12.50
Original Price $25.00
-
Digital download
Rental Property Template Landlord Spreadsheet Income and Expense Tracker Rental Bookkeeping Excel Google Sheets Real Estate Management
Sale Price $26.95
Original Price $38.50
-
Digital download
Rental Property Tracker Landlord Spreadsheet simple Property Income and Expense Excel Google Sheets Rental Bookkeeping Rent Payment Tracker
Sale Price $5.50
Original Price $11.00
-
Digital download
Excel Vacation Property Spreadsheet, Small Business Spreadsheet, Airbnb Bookkeeping, Income Expense Tracker, Rental Property Management
$29.31
-
Digital download
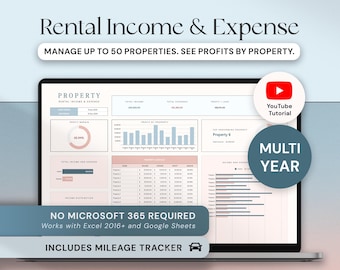
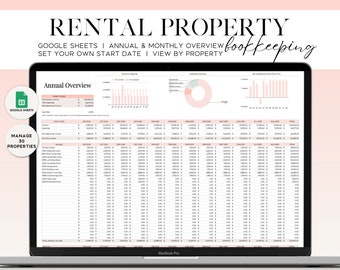
Rental Property Spreadsheet, Multi-Property Income & Expense Tracker, Rental Property Bookkeeping Google Sheets Template, Property Analyzer
Sale Price $21.00
Original Price $28.00
-

Digital download
Rental Property Bookkeeping Spreadsheet: 10-Year Summary (Google Sheet)
Sale Price $24.91
Original Price $33.22


