


Operation Flowchart Template Excel Google Sheets | Interactive Process Diagram Workflow Map SOP Builder RACI Dashboard Swimlane
Star Seller
Star Sellers have an outstanding track record for providing a great customer experience—they consistently earned 5-star reviews, shipped orders on time, and replied quickly to any messages they received.
Item highlights
Seller's description
📥 Instant access after purchase, no waiting
🖥️ Works on Google Sheets & Excel, no software needed
📱 Mobile friendly, use it on your phone too
💬 Stuck? Message me, I reply personally within a few hours
🔄 Free updates: if I improve this template, you get the new version free
Interactive Operation Flowchart Template Excel & Google Sheets | Process Diagram, Workflow Mapping, SOP Builder, RACI Matrix, KPI Dashboard, Bottleneck Tracker & Printable Flowchart Report
Building a flowchart manually is one of the most frustrating things in operations work.
You open Visio or draw.io. You spend an hour dragging shapes. You move one box and the whole diagram shifts. You share it with a colleague who does not have the right software. You need to update one step and redo half the layout.
There has to be a better way.
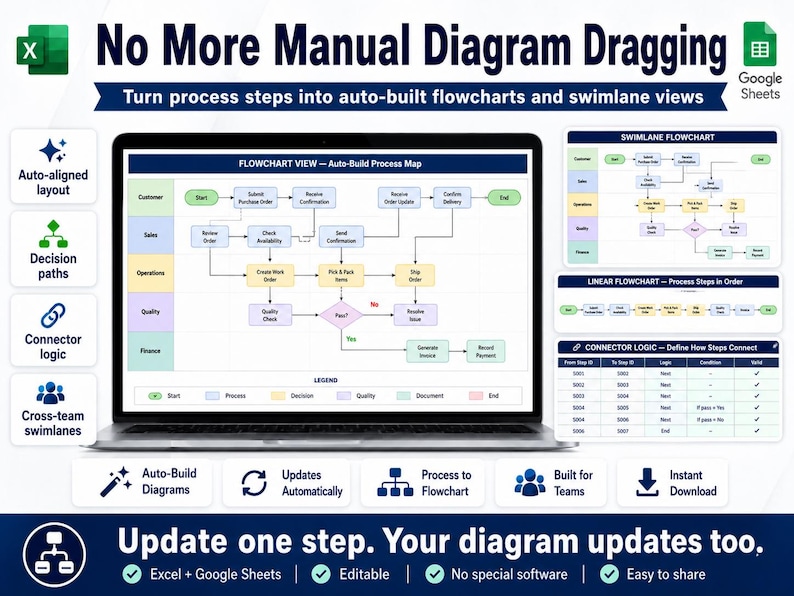
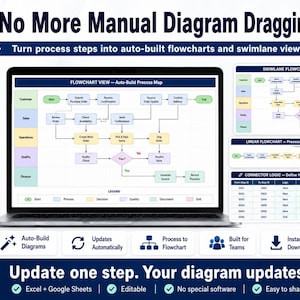
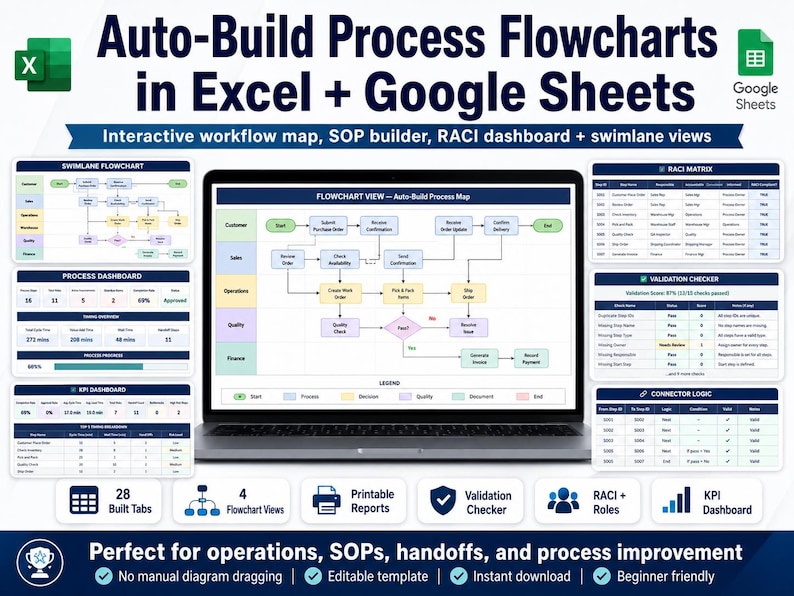
This Interactive Operation Flowchart Template lets you input your process steps, decisions, and connectors into a structured data sheet and see an organized, editable flowchart layout generated automatically in Excel or Google Sheets. No manual dragging. No specialist software. No diagram that breaks every time something changes.
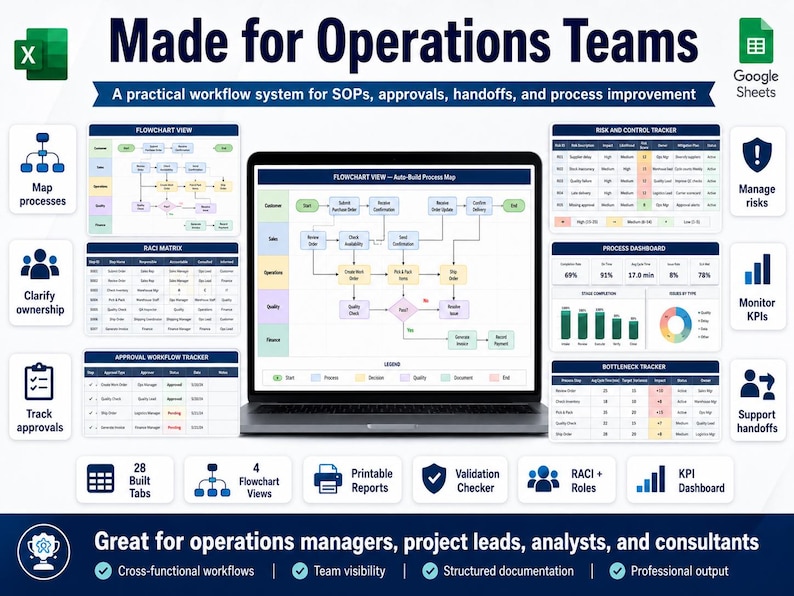
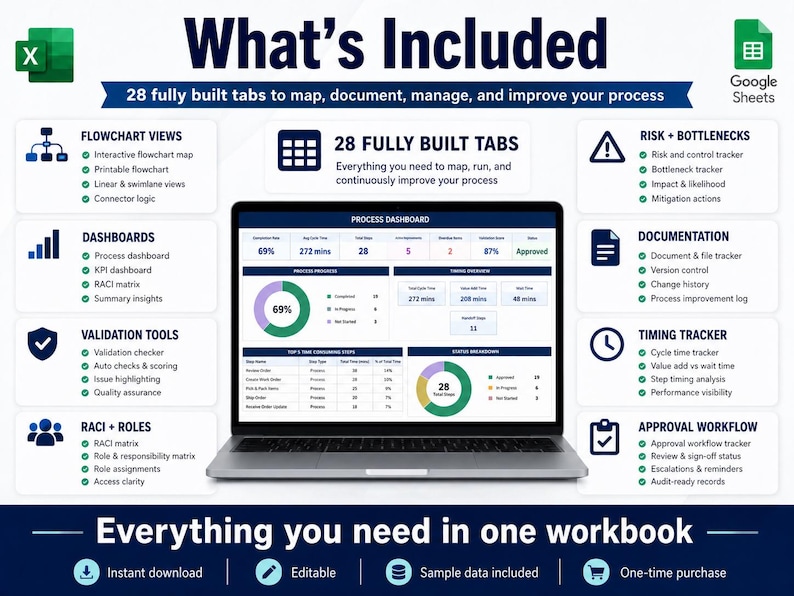
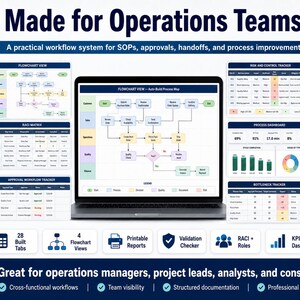
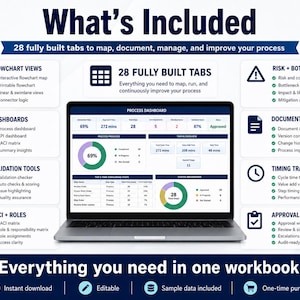
28 fully built tabs. Multiple flowchart views. SOP builder, RACI matrix, KPI dashboard, risk tracker, bottleneck log, and printable reports all connected to your process data.
🎯 THIS IS FOR YOU IF:
✔ You build process maps, workflow diagrams, or SOPs regularly
✔ You are tired of manual diagram tools that break when you update one step
✔ You need flowcharts that work in Excel or Google Sheets without specialist software
✔ You manage operations, projects, or teams and need structured process documentation
✔ You need RACI matrices, role assignments, and approval workflows alongside your diagrams
✔ You want KPI dashboards and bottleneck tracking connected to your process data
✔ You need printable flowcharts and SOP reports for training, compliance, or handover
📂 WHAT'S INCLUDED 28 FULLY BUILT TABS
🏠 START HERE & SETUP
✔ Welcome page with quick-start checklist and navigation links to all 28 tabs
✔ Setup tab enter your process name, department, version number, owner, date, and preferences
✔ Customize node types, swimlane labels, role names, KPI metrics, and risk categories
✔ All setup values feed across tabs automatically
✔ Diagram Styling Guide tab full reference for colors, shapes, line styles, and layout options
📋 PROCESS INPUT
✔ The central data entry tab enter all your process steps in a structured table
✔ Columns step ID, step name, step type, responsible role, input, output, decision condition, next step, alternative step, time estimate, notes
✔ Step types Start, Process, Decision, End, Delay, Document, Database, Manual Input, Subprocess
✔ Dropdown validation on all key fields consistent data, no free-text errors
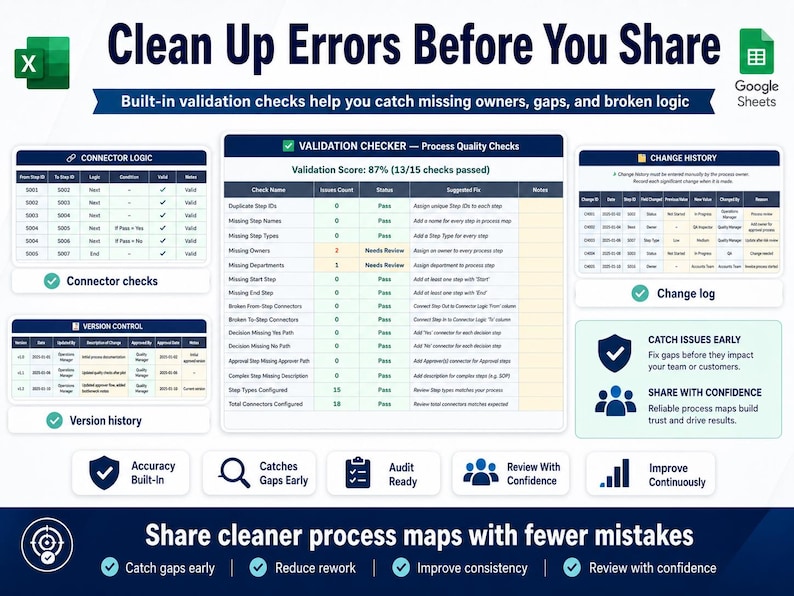
✔ Connector Logic tab define all connections between steps, decision branches, and flow paths
✔ Data entered here feeds every flowchart view, dashboard, and report automatically
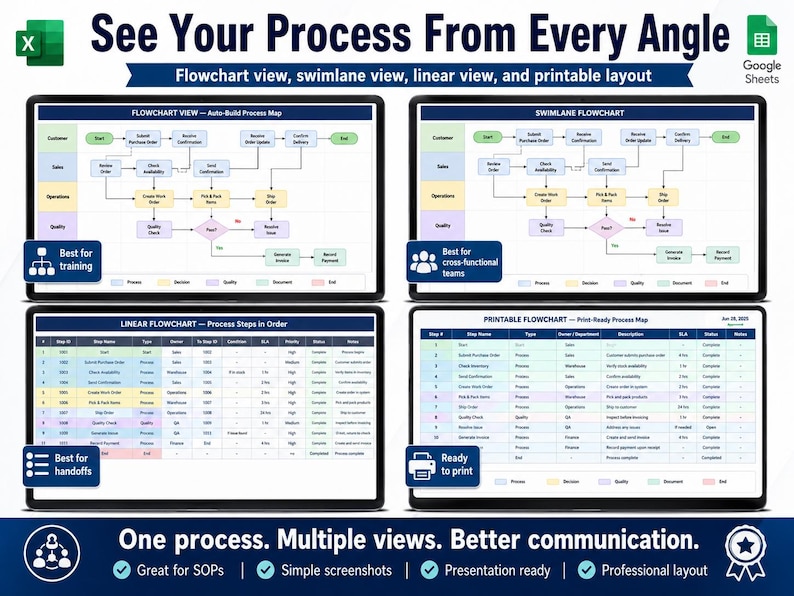
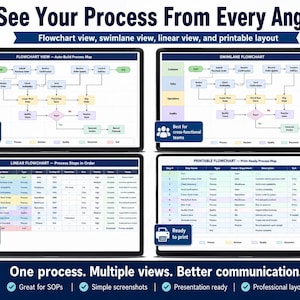
📊 FOUR FLOWCHART VIEWS
Flowchart View
✔ Auto-aligned flowchart layout built from your Process Input data
✔ Steps, decisions, and connectors organized and labeled automatically
✔ Customizable node styles, colors, and text labels
✔ Updates when you update your process input data
Swimlane Flowchart
✔ Swimlane layout steps organized by role or department automatically
✔ Cross-functional process flows shown clearly across lanes
✔ Ideal for multi-team workflows, handover points, and approval chains
✔ Lane labels pull from your role setup automatically
Linear Flowchart
✔ Clean left-to-right or top-to-bottom linear flow view
✔ Best for simple sequential processes and training materials
✔ Easy to screenshot, export, and embed into presentations or documents
Decision Tree View
✔ Decision-branch layout showing all yes or no paths from each decision point
✔ Multi-branch decision trees built automatically from your connector logic
✔ Ideal for troubleshooting guides, customer service flows, and compliance decision paths
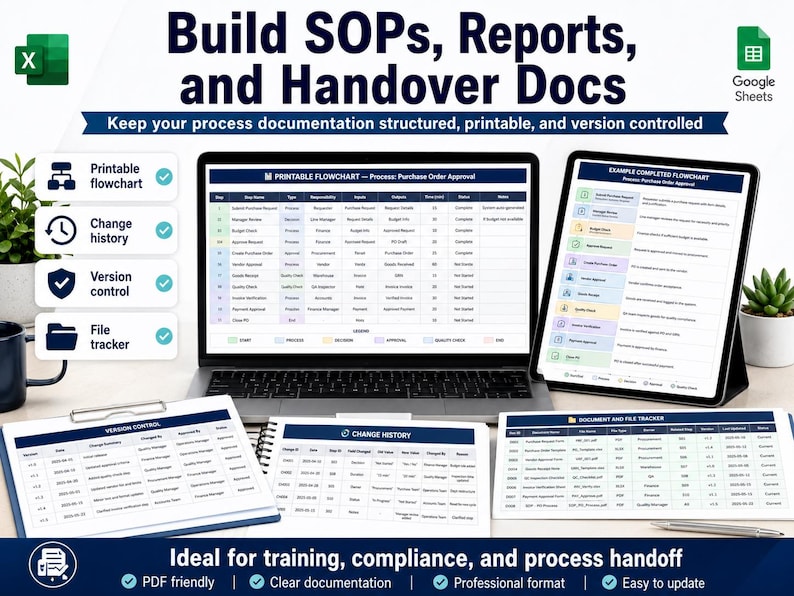
📝 SOP BUILDER
✔ Structured Standard Operating Procedure builder pulls step data from Process Input automatically
✔ SOP sections purpose, scope, responsibilities, step-by-step procedure, decision guidance, notes
✔ Role assignment per step shown clearly
✔ Version number and approval status fields
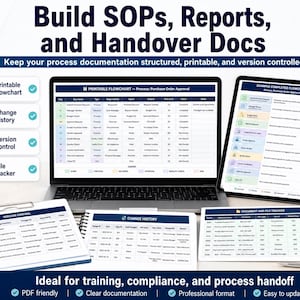
✔ Printable SOP Report tab — formatted for PDF export, training binders, and compliance documentation
✔ Sample SOP included see exactly how a completed SOP looks before building your own
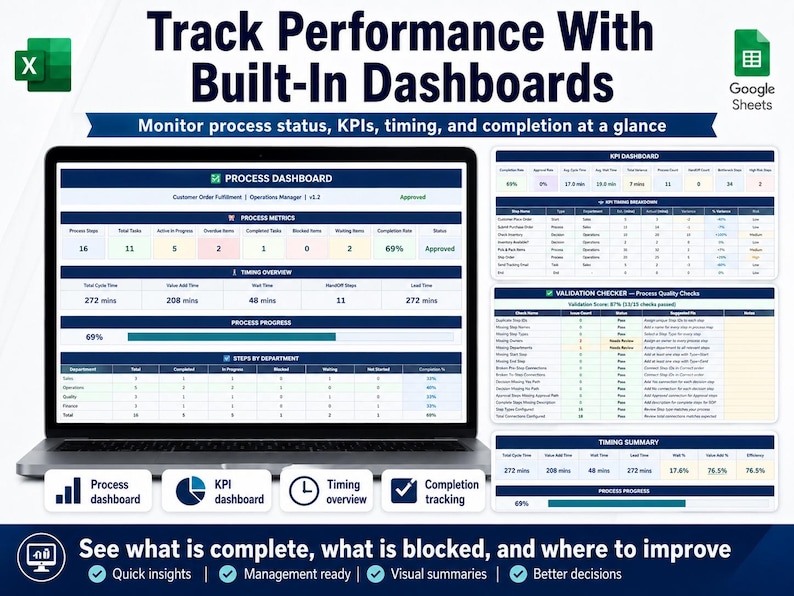
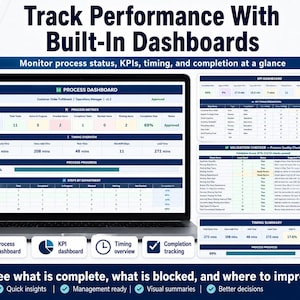
📊 PROCESS DASHBOARD
✔ End-to-end process overview all steps, roles, timings, and flow logic in one view
✔ Step count by type process steps, decisions, delays, subprocesses
✔ Role workload summary how many steps each role owns
✔ Process complexity score calculated from step count and decision branch count
✔ Bar chart for steps by role, donut chart for step type breakdown
✔ Updates automatically from Process Input data
📈 KPI DASHBOARD
✔ Key performance indicators for your process all calculated automatically
✔ Total process steps, total decision points, total roles involved
✔ Average cycle time per step, total estimated process cycle time
✔ Bottleneck count, risk count, open improvement actions
✔ Process efficiency score based on cycle times and bottleneck data
✔ Charts cycle time by step bar, KPI summary cards, process health indicators
✔ Updates automatically as you add timing and bottleneck data
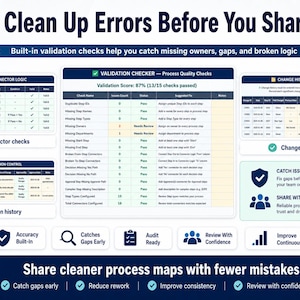
✅ VALIDATION CHECKER
✔ Automatically checks your process input for common errors before you finalize
✔ Flags missing step connections, orphaned steps with no input or output, circular logic warnings, missing role assignments, decision steps without both yes and no paths
✔ Validation summary shows total errors, total warnings, and total passed checks
✔ Color-coded results green for passed, amber for warning, red for error
✔ Resolve issues before your flowchart goes to a wider audience
👥 ROLE AND RESPONSIBILITY MATRIX
✔ Lists every role involved in the process with their assigned steps
✔ Step ownership, decision authority, and approval rights per role
✔ Count of steps per role calculated automatically
✔ Role workload comparison chart
✔ Feeds into RACI Matrix automatically
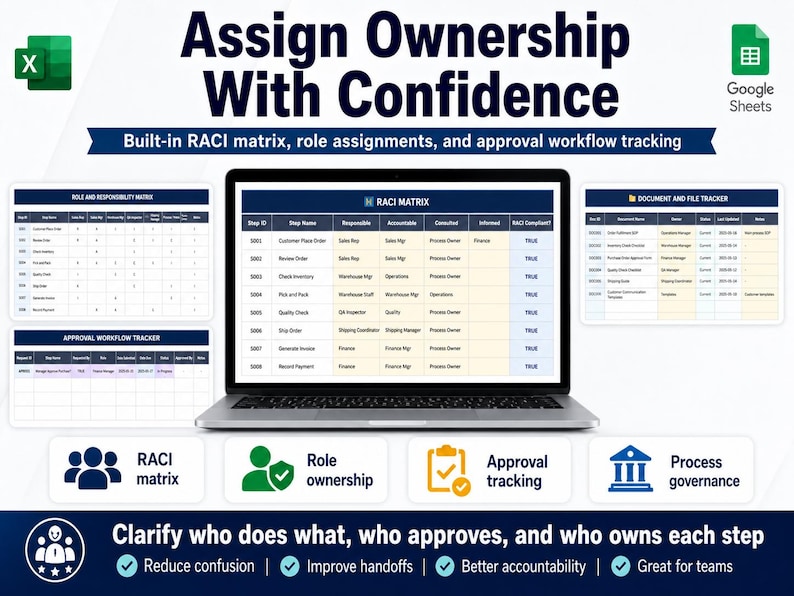
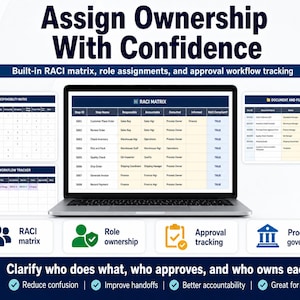
🔲 RACI MATRIX
✔ Complete RACI layout: Responsible, Accountable, Consulted, Informed per step and per role
✔ Pulls step names and role names from your setup data automatically
✔ Dropdown RACI assignment per cell R, A, C, I, or blank
✔ RACI completion percentage calculated
✔ Highlights steps with no Accountable role assigned a common RACI gap
✔ Printable RACI layout formatted for handover and governance documentation
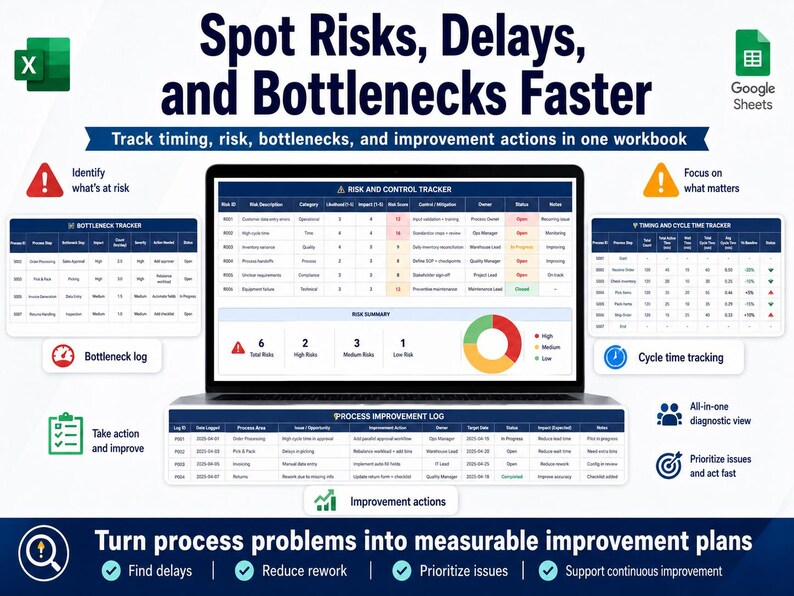
⏱️ TIMING AND CYCLE TIME TRACKER
✔ Log estimated and actual time per step minutes, hours, or days
✔ Total process cycle time calculated automatically
✔ Average step time calculated, longest step identified
✔ Estimated vs actual comparison per step
✔ Bar chart for step cycle times, line chart for cumulative process time
✔ Feeds KPI Dashboard cycle time metrics automatically
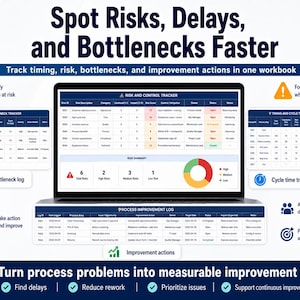
🚧 BOTTLENECK TRACKER
✔ Flag any step as a bottleneck and log the reason, impact level, and owner
✔ Bottleneck severity Low, Medium, High, Critical
✔ Suggested resolution field per bottleneck
✔ Total bottlenecks counted, high and critical bottlenecks highlighted
✔ Bottleneck summary feeds KPI Dashboard and Process Improvement Log
✔ Bar chart for bottlenecks by step, donut chart for severity breakdown
⚠️ RISK AND CONTROL TRACKER
✔ Log every process risk risk description, step affected, likelihood, impact, risk level
✔ Control measures, control owner, and control effectiveness per risk
✔ Risk level calculates automatically Low, Medium, High, Critical from likelihood and impact
✔ Residual risk after controls shown automatically
✔ Total risks, high risks, and uncontrolled risks counted
✔ Bar chart for risks by step, donut chart for risk level distribution
✅ APPROVAL WORKFLOW TRACKER
✔ Track every approval required in your process step name, approver, approval type, status, date
✔ Approval status Pending, Approved, Rejected, Escalated, Not Required
✔ Approval completion percentage calculated automatically
✔ Overdue approvals highlighted, pending approvals highlighted
✔ Bar chart for approval status, countdown to approval deadlines
📁 DOCUMENT AND FILE TRACKER
✔ Log every document, form, or file referenced in your process document name, step, owner, version, link
✔ Document status Current, Outdated, Missing, Under Review
✔ Missing documents highlighted automatically
✔ Document completion percentage calculated
✔ Feeds into Printable SOP Report automatically
💡 PROCESS IMPROVEMENT LOG
✔ Log every improvement idea, action, or change request for the process
✔ Improvement type Efficiency, Quality, Compliance, Automation, Cost Reduction, Other
✔ Priority, owner, due date, status, and outcome per improvement
✔ Open improvements counted, overdue improvements highlighted
✔ Bar chart for improvements by type, donut chart for improvement status
📋 VERSION CONTROL AND CHANGE HISTORY
✔ Version Control tab track every version of the process with version number, date, owner, and summary of changes
✔ Change History tab detailed log of every individual change made to any step, role, or connection
✔ Current version shown on all printable outputs automatically
✔ Full audit trail for compliance and governance requirements
🖨️ TWO PRINTABLE OUTPUTS
✔ Printable Flowchart clean formatted flowchart layout ready for PDF export, printing, or embedding in presentations and training materials
✔ Printable SOP Report complete standard operating procedure document with process overview, step-by-step procedure, roles, decisions, risks, approvals, and version history formatted for A4 and Letter paper sizes
✔ Both outputs pull data automatically no manual reformatting needed
📖 EXAMPLE, INSTRUCTIONS AND FORMULA GUIDE
✔ Example Completed Flowchart tab full working example with sample process data across all tabs
✔ Instructions tab step-by-step guide covering every feature in plain language
✔ Formula Guide tab explains every calculation, status logic, and automation in the file
✔ Diagram Styling Guide tab reference for all shape types, color codes, connector styles, and layout options
📦 WHAT YOU RECEIVE
✔ Excel (.xlsx) version works on Windows and Mac, Office 365 recommended
✔ Google Sheets version one-click copy to your Drive via PDF link
✔ Both versions include all 28 tabs fully built and connected
✔ Sample process data pre-loaded preview everything working before entering your own
✔ Instant digital download files in your Etsy downloads immediately after purchase
✔ Lifetime access no subscription, no expiry, no renewal fee ever
✔ Full customer support real personal replies whenever you need help
🚀 HOW TO GET STARTED
Purchase files arrive in Etsy downloads instantly
Open in Excel or Google Sheets both versions included
Open the Setup tab enter your process name, department, and role names
Open Process Input list your steps, decisions, and connectors in the structured table
Open Connector Logic define the flow path between each step
Open Flowchart View your organized layout appears automatically
Choose your view Swimlane, Linear, or Decision Tree depending on your audience
Complete RACI and Timing fill in roles, times, and responsibilities
Run Validation Checker confirm no errors before sharing or printing
Export your outputs print the flowchart and SOP report as PDF
📱 WORKS ON EVERY DEVICE
✔ Phone review process flows and update step data on the go
✔ Tablet full flowchart and dashboard view
✔ Laptop and Desktop complete process mapping and documentation experience
✔ Google Sheets version syncs across all devices automatically
✔ Excel version works fully offline no internet required
❓ QUESTIONS ANSWERED
Do I need Visio or specialist diagram software?
No. This template works entirely within Excel and Google Sheets. No third-party software, no plugins, no specialist tools required. If you can open a spreadsheet you can build a professional flowchart.
How does the auto flowchart layout work?
You enter your process steps, step types, and connections into the Process Input and Connector Logic tabs. The Flowchart View tab reads that data and generates an organized, labeled layout automatically. Update your input data and the flowchart updates.
Does it support swimlane diagrams?
Yes. The Swimlane Flowchart tab organizes your steps into lanes by role or department automatically using the role assignments from your Process Input. It is ideal for cross-functional workflows and handover documentation.
Can I export the flowchart as an image or PDF?
Yes. The Printable Flowchart tab is formatted for clean PDF export. In Excel, use File Export PDF. In Google Sheets, use File Download PDF. The output can also be screenshot and embedded into presentations, SOPs, or training materials.
Does it work for both simple and complex processes?
Yes. The linear flowchart view handles simple sequential processes. The swimlane and decision tree views handle multi-role, multi-branch, and complex processes. The validation checker catches logic errors in complex flows before you share them.
Is this a one-time purchase?
Yes. Pay once and use it for unlimited processes across unlimited projects. No subscription, no renewal, no expiry.
What if I need help?
Message the shop directly. Real personal replies within 24 hours and full support until everything is working perfectly for your process documentation.
🏆 PERFECT FOR
✔ Operations managers documenting and improving business processes
✔ Process engineers mapping manufacturing or production workflows
✔ Business analysts creating process diagrams for stakeholders
✔ Project managers building approval workflows and RACI matrices
✔ Quality and compliance teams creating SOPs and audit trails
✔ Educators and trainers building visual training flowcharts
✔ Consultants delivering process mapping work to clients
✔ Anyone who needs professional flowcharts without paying for Visio
⭐ WHY THIS BEATS VISIO AND DRAW.IO
Visio costs money every month. draw.io requires manual shape placement. Both break when you update a step. Neither generates a RACI matrix, KPI dashboard, bottleneck tracker, or printable SOP report from your diagram data.
This template does all of that in a tool you already have and already know how to use.
→ No manual dragging input data, flowchart builds automatically
→ 28 connected tabs flowchart, SOP, RACI, KPI, risks, approvals, versions all linked
→ Four diagram views standard, swimlane, linear, and decision tree
→ Validation checker catches logic errors before you share anything
→ Printable outputs flowchart and SOP report both formatted for PDF
→ Works offline Excel version needs no internet connection at all
→ One-time cost not a monthly subscription you forget to cancel
⚠️ IMPORTANT NOTES
✔ Digital download only no physical item will be shipped
✔ Available in English
✔ Excel version Office 365 recommended for full compatibility, works on Excel 2016 and above
✔ Google Sheets version free Google account required
✔ Flowchart layouts are formula and formatting based advanced diagramming features require manual shape work for highly complex custom visual requirements
✔ For personal and single-business use reselling or redistribution not permitted
✔ Minor visual differences may exist between Excel and Google Sheets versions
📥 HOW TO ACCESS YOUR FILES AFTER PURCHASE
✔ Check your email Etsy sends an automatic download link immediately after payment
✔ Visit etsy.com/your/purchases your files are always available there anytime
🔄 REFUND POLICY
Due to the instant-access nature of digital downloads, refunds cannot be processed once files have been accessed. If anything is not working as expected, message the shop immediately. Every issue will be resolved personally and promptly with full support.
Input your steps. See your flowchart.
Document your process. Share it with confidence.
Build better workflows today. 📊
In 6 carts
Price:$6.99
Original Price: $9.99
30% off
Limited time sale
You can only make an offer when buying a single item
Delivery
Instant download
Your files will be available to download once payment is confirmed. Here's how.
Instant download items don't accept returns, exchanges or cancellations. Please contact the seller about any problems with your order.
Reviews for this item
This item met my needs and preformed it functions perfectly
Response from Sidra Nizamani
Thank you so much, Trisha! "Performed perfectly" is exactly what I aim for. Enjoy mapping out your processes — and reach out anytime if you'd like a hand with any of the tabs. 💛
Seller's description
Specifications
📥 Instant access after purchase, no waiting
🖥️ Works on Google Sheets & Excel, no software needed
📱 Mobile friendly, use it on your phone too
💬 Stuck? Message me, I reply personally within a few hours
🔄 Free updates: if I improve this template, you get the new version free
Interactive Operation Flowchart Template Excel & Google Sheets | Process Diagram, Workflow Mapping, SOP Builder, RACI Matrix, KPI Dashboard, Bottleneck Tracker & Printable Flowchart Report
Building a flowchart manually is one of the most frustrating things in operations work.
You open Visio or draw.io. You spend an hour dragging shapes. You move one box and the whole diagram shifts. You share it with a colleague who does not have the right software. You need to update one step and redo half the layout.
There has to be a better way.
This Interactive Operation Flowchart Template lets you input your process steps, decisions, and connectors into a structured data sheet and see an organized, editable flowchart layout generated automatically in Excel or Google Sheets. No manual dragging. No specialist software. No diagram that breaks every time something changes.
28 fully built tabs. Multiple flowchart views. SOP builder, RACI matrix, KPI dashboard, risk tracker, bottleneck log, and printable reports all connected to your process data.
🎯 THIS IS FOR YOU IF:
✔ You build process maps, workflow diagrams, or SOPs regularly
✔ You are tired of manual diagram tools that break when you update one step
✔ You need flowcharts that work in Excel or Google Sheets without specialist software
✔ You manage operations, projects, or teams and need structured process documentation
✔ You need RACI matrices, role assignments, and approval workflows alongside your diagrams
✔ You want KPI dashboards and bottleneck tracking connected to your process data
✔ You need printable flowcharts and SOP reports for training, compliance, or handover
📂 WHAT'S INCLUDED 28 FULLY BUILT TABS
🏠 START HERE & SETUP
✔ Welcome page with quick-start checklist and navigation links to all 28 tabs
✔ Setup tab enter your process name, department, version number, owner, date, and preferences
✔ Customize node types, swimlane labels, role names, KPI metrics, and risk categories
✔ All setup values feed across tabs automatically
✔ Diagram Styling Guide tab full reference for colors, shapes, line styles, and layout options
📋 PROCESS INPUT
✔ The central data entry tab enter all your process steps in a structured table
✔ Columns step ID, step name, step type, responsible role, input, output, decision condition, next step, alternative step, time estimate, notes
✔ Step types Start, Process, Decision, End, Delay, Document, Database, Manual Input, Subprocess
✔ Dropdown validation on all key fields consistent data, no free-text errors
✔ Connector Logic tab define all connections between steps, decision branches, and flow paths
✔ Data entered here feeds every flowchart view, dashboard, and report automatically
📊 FOUR FLOWCHART VIEWS
Flowchart View
✔ Auto-aligned flowchart layout built from your Process Input data
✔ Steps, decisions, and connectors organized and labeled automatically
✔ Customizable node styles, colors, and text labels
✔ Updates when you update your process input data
Swimlane Flowchart
✔ Swimlane layout steps organized by role or department automatically
✔ Cross-functional process flows shown clearly across lanes
✔ Ideal for multi-team workflows, handover points, and approval chains
✔ Lane labels pull from your role setup automatically
Linear Flowchart
✔ Clean left-to-right or top-to-bottom linear flow view
✔ Best for simple sequential processes and training materials
✔ Easy to screenshot, export, and embed into presentations or documents
Decision Tree View
✔ Decision-branch layout showing all yes or no paths from each decision point
✔ Multi-branch decision trees built automatically from your connector logic
✔ Ideal for troubleshooting guides, customer service flows, and compliance decision paths
📝 SOP BUILDER
✔ Structured Standard Operating Procedure builder pulls step data from Process Input automatically
✔ SOP sections purpose, scope, responsibilities, step-by-step procedure, decision guidance, notes
✔ Role assignment per step shown clearly
✔ Version number and approval status fields
✔ Printable SOP Report tab — formatted for PDF export, training binders, and compliance documentation
✔ Sample SOP included see exactly how a completed SOP looks before building your own
📊 PROCESS DASHBOARD
✔ End-to-end process overview all steps, roles, timings, and flow logic in one view
✔ Step count by type process steps, decisions, delays, subprocesses
✔ Role workload summary how many steps each role owns
✔ Process complexity score calculated from step count and decision branch count
✔ Bar chart for steps by role, donut chart for step type breakdown
✔ Updates automatically from Process Input data
📈 KPI DASHBOARD
✔ Key performance indicators for your process all calculated automatically
✔ Total process steps, total decision points, total roles involved
✔ Average cycle time per step, total estimated process cycle time
✔ Bottleneck count, risk count, open improvement actions
✔ Process efficiency score based on cycle times and bottleneck data
✔ Charts cycle time by step bar, KPI summary cards, process health indicators
✔ Updates automatically as you add timing and bottleneck data
✅ VALIDATION CHECKER
✔ Automatically checks your process input for common errors before you finalize
✔ Flags missing step connections, orphaned steps with no input or output, circular logic warnings, missing role assignments, decision steps without both yes and no paths
✔ Validation summary shows total errors, total warnings, and total passed checks
✔ Color-coded results green for passed, amber for warning, red for error
✔ Resolve issues before your flowchart goes to a wider audience
👥 ROLE AND RESPONSIBILITY MATRIX
✔ Lists every role involved in the process with their assigned steps
✔ Step ownership, decision authority, and approval rights per role
✔ Count of steps per role calculated automatically
✔ Role workload comparison chart
✔ Feeds into RACI Matrix automatically
🔲 RACI MATRIX
✔ Complete RACI layout: Responsible, Accountable, Consulted, Informed per step and per role
✔ Pulls step names and role names from your setup data automatically
✔ Dropdown RACI assignment per cell R, A, C, I, or blank
✔ RACI completion percentage calculated
✔ Highlights steps with no Accountable role assigned a common RACI gap
✔ Printable RACI layout formatted for handover and governance documentation
⏱️ TIMING AND CYCLE TIME TRACKER
✔ Log estimated and actual time per step minutes, hours, or days
✔ Total process cycle time calculated automatically
✔ Average step time calculated, longest step identified
✔ Estimated vs actual comparison per step
✔ Bar chart for step cycle times, line chart for cumulative process time
✔ Feeds KPI Dashboard cycle time metrics automatically
🚧 BOTTLENECK TRACKER
✔ Flag any step as a bottleneck and log the reason, impact level, and owner
✔ Bottleneck severity Low, Medium, High, Critical
✔ Suggested resolution field per bottleneck
✔ Total bottlenecks counted, high and critical bottlenecks highlighted
✔ Bottleneck summary feeds KPI Dashboard and Process Improvement Log
✔ Bar chart for bottlenecks by step, donut chart for severity breakdown
⚠️ RISK AND CONTROL TRACKER
✔ Log every process risk risk description, step affected, likelihood, impact, risk level
✔ Control measures, control owner, and control effectiveness per risk
✔ Risk level calculates automatically Low, Medium, High, Critical from likelihood and impact
✔ Residual risk after controls shown automatically
✔ Total risks, high risks, and uncontrolled risks counted
✔ Bar chart for risks by step, donut chart for risk level distribution
✅ APPROVAL WORKFLOW TRACKER
✔ Track every approval required in your process step name, approver, approval type, status, date
✔ Approval status Pending, Approved, Rejected, Escalated, Not Required
✔ Approval completion percentage calculated automatically
✔ Overdue approvals highlighted, pending approvals highlighted
✔ Bar chart for approval status, countdown to approval deadlines
📁 DOCUMENT AND FILE TRACKER
✔ Log every document, form, or file referenced in your process document name, step, owner, version, link
✔ Document status Current, Outdated, Missing, Under Review
✔ Missing documents highlighted automatically
✔ Document completion percentage calculated
✔ Feeds into Printable SOP Report automatically
💡 PROCESS IMPROVEMENT LOG
✔ Log every improvement idea, action, or change request for the process
✔ Improvement type Efficiency, Quality, Compliance, Automation, Cost Reduction, Other
✔ Priority, owner, due date, status, and outcome per improvement
✔ Open improvements counted, overdue improvements highlighted
✔ Bar chart for improvements by type, donut chart for improvement status
📋 VERSION CONTROL AND CHANGE HISTORY
✔ Version Control tab track every version of the process with version number, date, owner, and summary of changes
✔ Change History tab detailed log of every individual change made to any step, role, or connection
✔ Current version shown on all printable outputs automatically
✔ Full audit trail for compliance and governance requirements
🖨️ TWO PRINTABLE OUTPUTS
✔ Printable Flowchart clean formatted flowchart layout ready for PDF export, printing, or embedding in presentations and training materials
✔ Printable SOP Report complete standard operating procedure document with process overview, step-by-step procedure, roles, decisions, risks, approvals, and version history formatted for A4 and Letter paper sizes
✔ Both outputs pull data automatically no manual reformatting needed
📖 EXAMPLE, INSTRUCTIONS AND FORMULA GUIDE
✔ Example Completed Flowchart tab full working example with sample process data across all tabs
✔ Instructions tab step-by-step guide covering every feature in plain language
✔ Formula Guide tab explains every calculation, status logic, and automation in the file
✔ Diagram Styling Guide tab reference for all shape types, color codes, connector styles, and layout options
📦 WHAT YOU RECEIVE
✔ Excel (.xlsx) version works on Windows and Mac, Office 365 recommended
✔ Google Sheets version one-click copy to your Drive via PDF link
✔ Both versions include all 28 tabs fully built and connected
✔ Sample process data pre-loaded preview everything working before entering your own
✔ Instant digital download files in your Etsy downloads immediately after purchase
✔ Lifetime access no subscription, no expiry, no renewal fee ever
✔ Full customer support real personal replies whenever you need help
🚀 HOW TO GET STARTED
Purchase files arrive in Etsy downloads instantly
Open in Excel or Google Sheets both versions included
Open the Setup tab enter your process name, department, and role names
Open Process Input list your steps, decisions, and connectors in the structured table
Open Connector Logic define the flow path between each step
Open Flowchart View your organized layout appears automatically
Choose your view Swimlane, Linear, or Decision Tree depending on your audience
Complete RACI and Timing fill in roles, times, and responsibilities
Run Validation Checker confirm no errors before sharing or printing
Export your outputs print the flowchart and SOP report as PDF
📱 WORKS ON EVERY DEVICE
✔ Phone review process flows and update step data on the go
✔ Tablet full flowchart and dashboard view
✔ Laptop and Desktop complete process mapping and documentation experience
✔ Google Sheets version syncs across all devices automatically
✔ Excel version works fully offline no internet required
❓ QUESTIONS ANSWERED
Do I need Visio or specialist diagram software?
No. This template works entirely within Excel and Google Sheets. No third-party software, no plugins, no specialist tools required. If you can open a spreadsheet you can build a professional flowchart.
How does the auto flowchart layout work?
You enter your process steps, step types, and connections into the Process Input and Connector Logic tabs. The Flowchart View tab reads that data and generates an organized, labeled layout automatically. Update your input data and the flowchart updates.
Does it support swimlane diagrams?
Yes. The Swimlane Flowchart tab organizes your steps into lanes by role or department automatically using the role assignments from your Process Input. It is ideal for cross-functional workflows and handover documentation.
Can I export the flowchart as an image or PDF?
Yes. The Printable Flowchart tab is formatted for clean PDF export. In Excel, use File Export PDF. In Google Sheets, use File Download PDF. The output can also be screenshot and embedded into presentations, SOPs, or training materials.
Does it work for both simple and complex processes?
Yes. The linear flowchart view handles simple sequential processes. The swimlane and decision tree views handle multi-role, multi-branch, and complex processes. The validation checker catches logic errors in complex flows before you share them.
Is this a one-time purchase?
Yes. Pay once and use it for unlimited processes across unlimited projects. No subscription, no renewal, no expiry.
What if I need help?
Message the shop directly. Real personal replies within 24 hours and full support until everything is working perfectly for your process documentation.
🏆 PERFECT FOR
✔ Operations managers documenting and improving business processes
✔ Process engineers mapping manufacturing or production workflows
✔ Business analysts creating process diagrams for stakeholders
✔ Project managers building approval workflows and RACI matrices
✔ Quality and compliance teams creating SOPs and audit trails
✔ Educators and trainers building visual training flowcharts
✔ Consultants delivering process mapping work to clients
✔ Anyone who needs professional flowcharts without paying for Visio
⭐ WHY THIS BEATS VISIO AND DRAW.IO
Visio costs money every month. draw.io requires manual shape placement. Both break when you update a step. Neither generates a RACI matrix, KPI dashboard, bottleneck tracker, or printable SOP report from your diagram data.
This template does all of that in a tool you already have and already know how to use.
→ No manual dragging input data, flowchart builds automatically
→ 28 connected tabs flowchart, SOP, RACI, KPI, risks, approvals, versions all linked
→ Four diagram views standard, swimlane, linear, and decision tree
→ Validation checker catches logic errors before you share anything
→ Printable outputs flowchart and SOP report both formatted for PDF
→ Works offline Excel version needs no internet connection at all
→ One-time cost not a monthly subscription you forget to cancel
⚠️ IMPORTANT NOTES
✔ Digital download only no physical item will be shipped
✔ Available in English
✔ Excel version Office 365 recommended for full compatibility, works on Excel 2016 and above
✔ Google Sheets version free Google account required
✔ Flowchart layouts are formula and formatting based advanced diagramming features require manual shape work for highly complex custom visual requirements
✔ For personal and single-business use reselling or redistribution not permitted
✔ Minor visual differences may exist between Excel and Google Sheets versions
📥 HOW TO ACCESS YOUR FILES AFTER PURCHASE
✔ Check your email Etsy sends an automatic download link immediately after payment
✔ Visit etsy.com/your/purchases your files are always available there anytime
🔄 REFUND POLICY
Due to the instant-access nature of digital downloads, refunds cannot be processed once files have been accessed. If anything is not working as expected, message the shop immediately. Every issue will be resolved personally and promptly with full support.
Input your steps. See your flowchart.
Document your process. Share it with confidence.
Build better workflows today. 📊
-
Designed by
-
Item typeDigital download
-
Digital file type(s)1 PDF, 2 other files
This seller consistently earned 5-star reviews, shipped orders on time, and replied quickly to messages.
If something goes wrong with an order, we've got your back on all eligible purchases. View program terms
Meet your seller

Usually responds in a few hours
Speedy replies Has a history of replying to messages quickly.
Rave reviews Average review rating is 4.8 or higher.
More from this shop
-

Digital download
ISO 9001 Document Control Spreadsheet, Google Sheets & Excel, Document Register, Revision, Review and Audit Readiness Tracker, QMS
Sale Price $6.99
Original Price $9.99
-

Digital download
Continuous Improvement Tracker, Lean Six Sigma and Kaizen Toolkit, PDCA A3 Root Cause Template, Google Sheets & Excel Spreadsheet
Sale Price $6.99
Original Price $9.99
-

Digital download
Production Planning Spreadsheet, Google Sheets & Excel, Manufacturing Schedule, Work Order, BOM and Capacity Tracker
Sale Price $6.99
Original Price $9.99
-

Digital download
SOP Template Spreadsheet Google Sheets | Standard Operating Procedure Builder Process Manual Compliance Training Tracker
Sale Price $6.99
Original Price $9.99
-

Digital download
Meeting Minutes & Agenda Template, Google Sheets and Excel, Action Item Tracker, Decision Log and Meeting Management Dashboard
Sale Price $6.99
Original Price $9.99
-

Digital download
Business Process Template Spreadsheet Google Sheets Excel | Workflow Documentation Procedure Tracker SOP Process Map Dashboard
Sale Price $6.99
Original Price $9.99
-

Digital download
Operation Flowchart Template Excel & Google Sheets: Map Business Processes and Workflows
Sale Price $4.49
Original Price $6.60
-

Digital download
20+ Process Templates: Business ǀ Personal ǀ Project ǀ HR ǀ Flowchart ǀ Diagram ǀ Map ǀ Manufacturing ǀ Workflow (Digital Download)
Sale Price $4.10
Original Price $8.20
-

Digital download
Production Management Manufacturing Operation Planning Excel Template Business System Factory Workflow Control Quality SOP Digital Download
Sale Price $2.73
Original Price $9.10
-

Digital download
50% Off | Operation Flowchart Sheet Template for Process Mapping | Visualize & Optimize Operations | Excel and Google Sheets
Sale Price $5.74
Original Price $11.47
-
Digital download
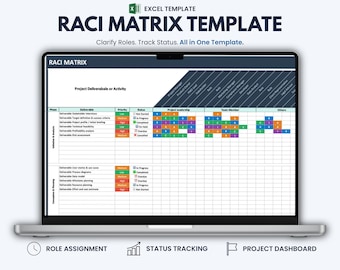
RACI Matrix Excel Template – Roles & Responsibilities Chart for Project Management
$7.71
-

Digital download
Accounts Workflow Efficiency Analysis Template | Excel + Google Sheets Dashboard | Process Optimization & KPI Tracker
Sale Price $4.49
Original Price $6.60
-

Digital download
Stakeholder Power Interest Matrix Spreadsheet, Excel & Google Sheet Project Management stakeholder analysis register, influence map template
$6.99
-

Digital download
Task Manager Excel Template: Eisenhower Matrix, Progress Tracker (Digital Download)
$6.20
-
Digital download
Agile Project Management Toolkit, Scrum Kanban XP Templates, Sprint Planning Roadmap Backlog, Editable PowerPoint & Excel, Digital Download
$8.04
-

Digital download
Engineering KPI Tracker | Excel + Google Sheets Dashboard for Metrics, Performance Reports & Business Analytics Management
Sale Price $4.49
Original Price $6.60
-

Digital download
Time Study Excel Template | Cycle Time Calculator & Process Timing Tool
$9.99
-
Digital download
Agile Kanban Board Template | Excel Project Management Tracker for Teams & Personal Use
$6.99
Shoppers with similar taste loved these
-

Digital download
Status Report Template, Project Update Template, Progress Report Template, Work Activity Report, Work Progress Summary, Task Status Update
$2.73
-

Digital download
Project Status Report Template PowerPoint | PSR Slide Pack for Project Managers & PMO Reporting
$11.47
-
Digital download
Employee Daily & Weekly Activity Report Template, Daily Work Report, Daily Progress Report, Daily Task Tracker, Task Tracker, Task Manager
$2.33
-

Digital download
Status Report Template: Weekly, Biweekly, Monthly - Google Docs, Excel, Word (Digital Download)
$3.00
-

Digital download
One Page Project Status Report for Business Executives, Managers, Project Managers, and Stakeholders - Digital Download
$3.00
-

Digital download
Change Management Template Bundle: Project & HR Forms (Digital)
$9.39
-

Digital download
Manager Project Status Report: Excel, Word, Google Docs (Digital Download)
$3.00
-
Digital download
Weekly Status Report Template | Manager Upward Boss Update (Fillable PDF + Word)
$8.95
-

Digital download
Issue Tracker Excel Template: Project Problem Log (Digital Download)
Sale Price $12.30
Original Price $20.50
-

Digital download
Issues and Concerns Tracker Spreadsheet, Excel project management template, business risk tracker log, issue resolution and handling
Sale Price $3.49
Original Price $4.99
-

Digital download
Issue Log, Issue Tracker, Issue Register, RAID Log, Issue Management, Project Management, Project Plan, MS Excel
$2.30
-

Digital download
Issue List in Excel | tracker | Issue Log | Project Management Dashboard | Digital Instant Download
Sale Price $2.99
Original Price $3.52


