





NowPrice:$11.68
Original Price: $14.97
22% off
Sale ends on September 9
Investment Portfolio Tracker Spreadsheet, Excel and Google Sheets | Stock Portfolio Cost Basis, Dividends, Allocation and Capital Gains
Star Seller
Star Sellers have an outstanding track record for providing a great customer experience—they consistently earned 5-star reviews, shipped orders on time, and replied quickly to any messages they received.
You can only make an offer when buying a single item
Star Seller. This seller consistently earned 5-star reviews, shipped on time, and replied quickly to any messages they received.
Highlights
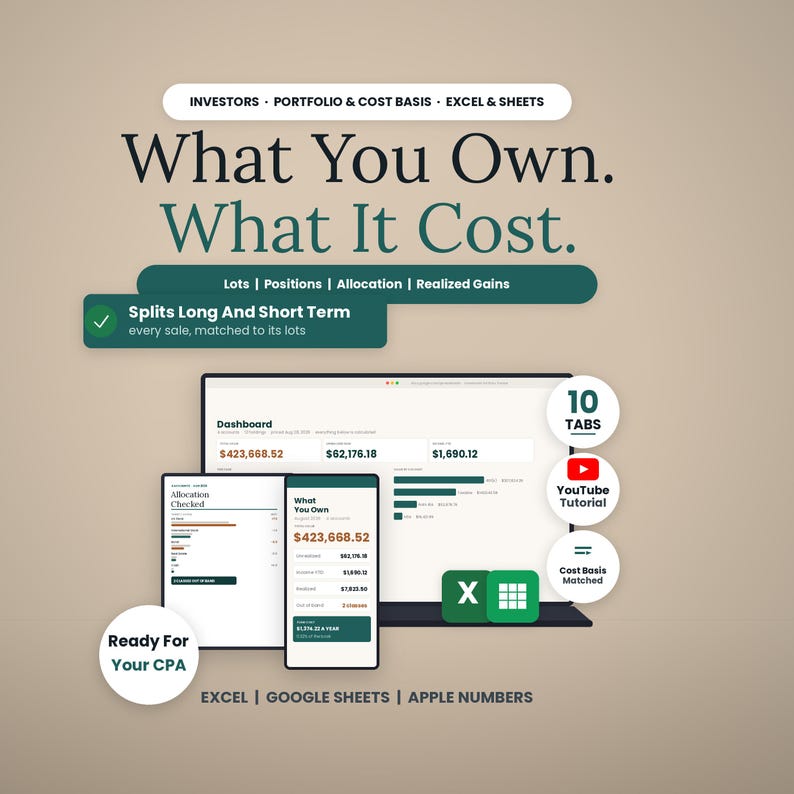
What you own, what it cost, what it is worth.
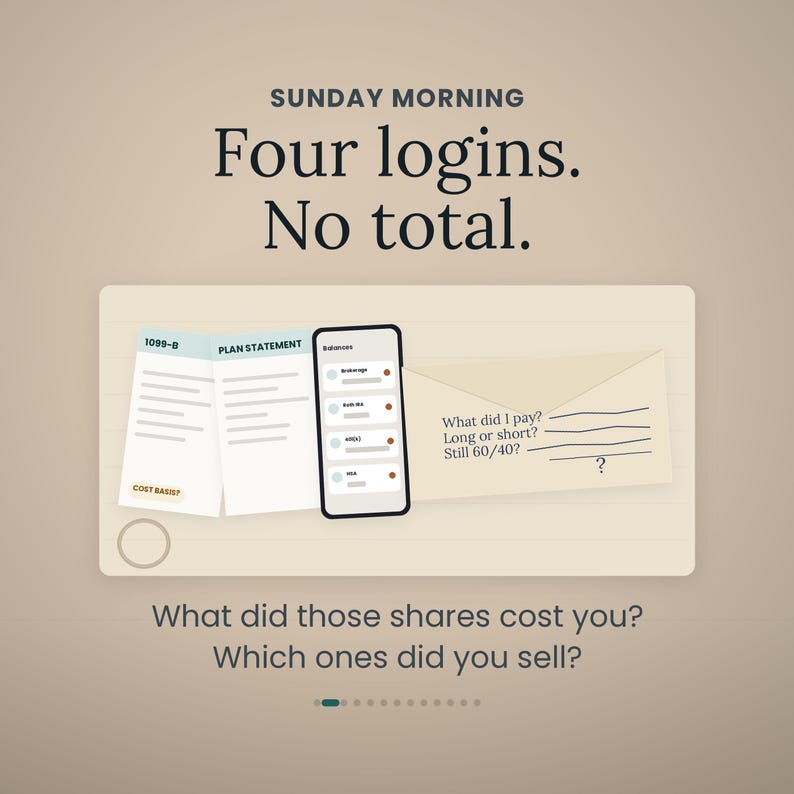
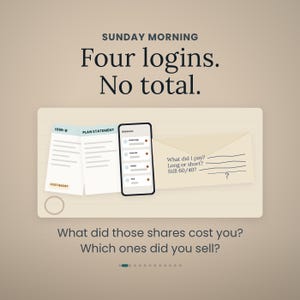
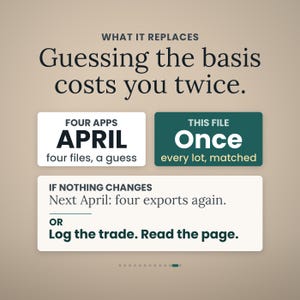
Four accounts, three apps, and none of them add up. The brokerage knows what one account holds. The plan knows about the plan. Nobody knows what you own. And when you sell, the question that decides your tax bill is not what the shares are worth, it is which shares you sold and how long you had held them. This file keeps the whole book in one place: every lot with what it cost, every sale matched to the lots it actually came from, and the long-term and short-term split written out the way your preparer wants to see it.
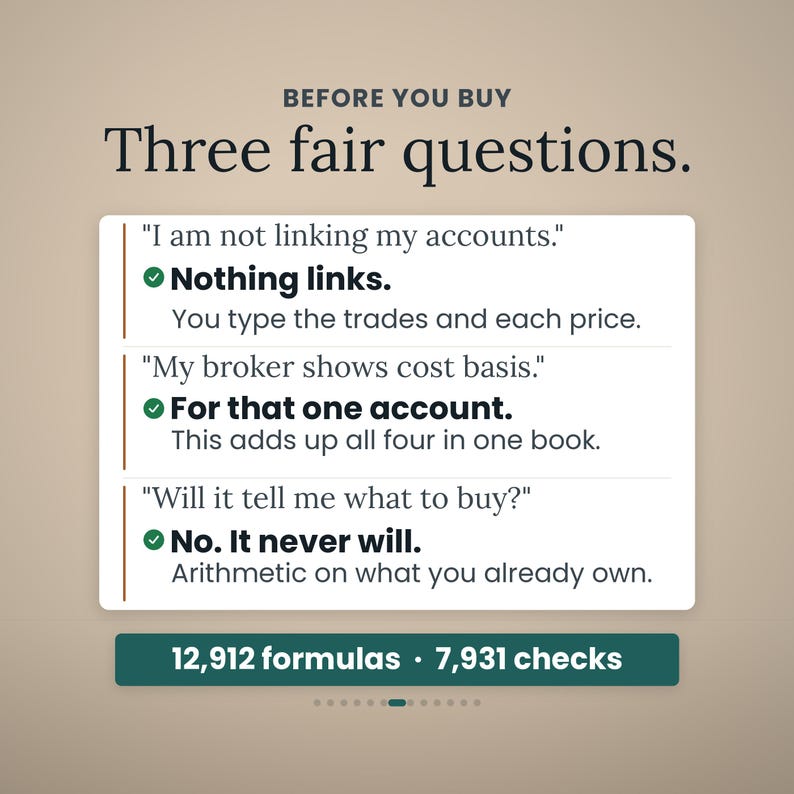
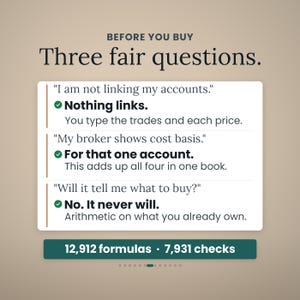
THREE THINGS TO KNOW BEFORE YOU BUY
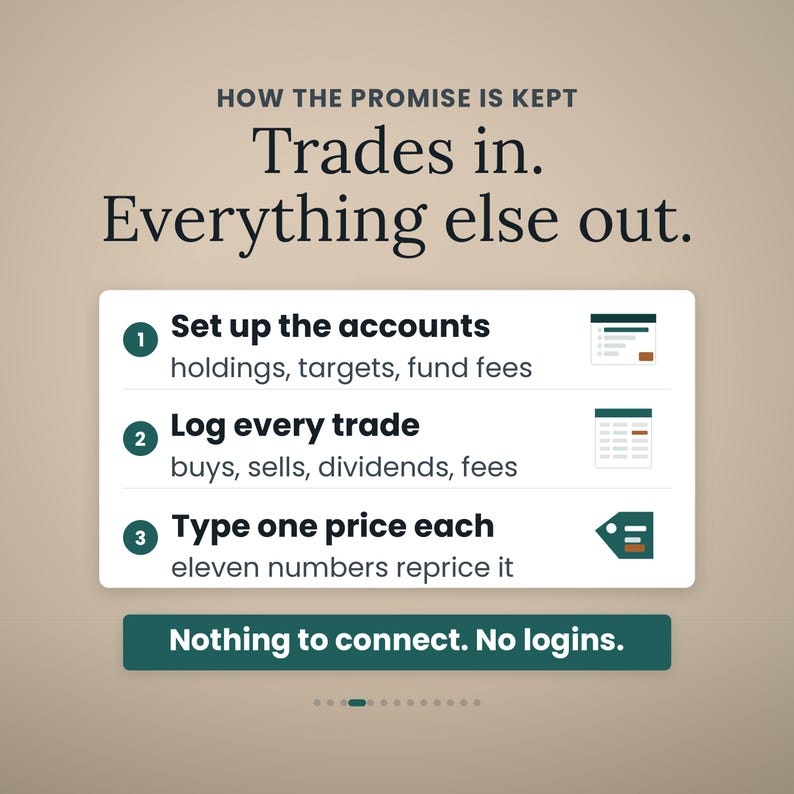
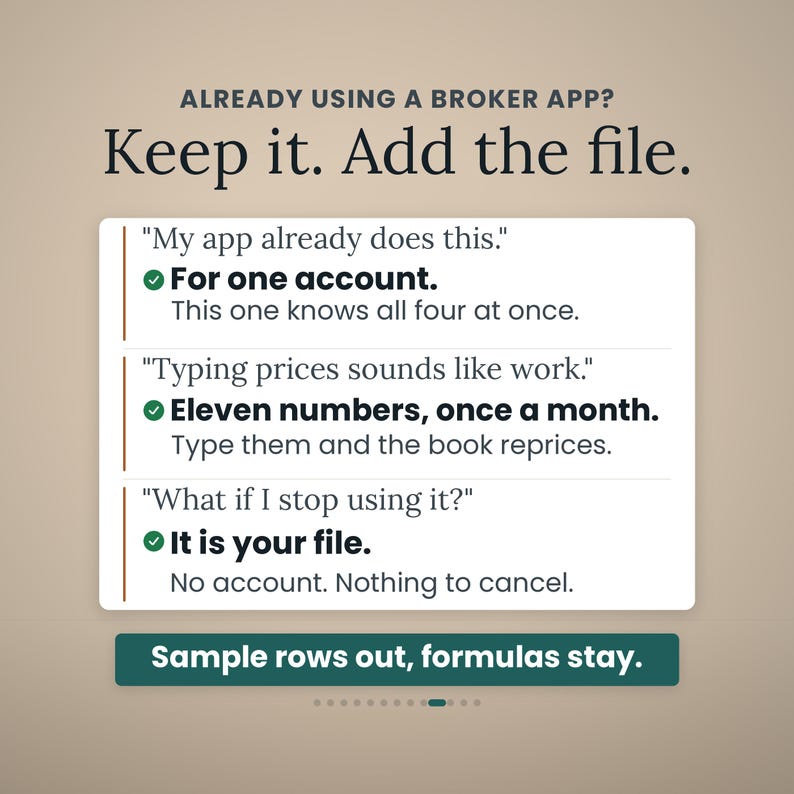
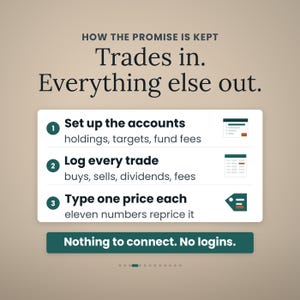
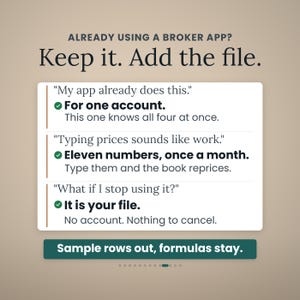
I am not linking my accounts. Nothing links. There is no login, no API key and no bank connection anywhere in this file. You type the trades, and you type one price per holding when you want a fresh picture. Eleven numbers in the sample book, once a month.
My broker already shows cost basis. For that one account. This adds up all four in one book, and it matches every sale to its lots itself, so you can see the arithmetic instead of trusting a number that arrives in February.
Will it tell me what to buy? No, and it never will. There is no advice, no recommendation, no projection and no forecast anywhere in it. It is arithmetic on what you already own.
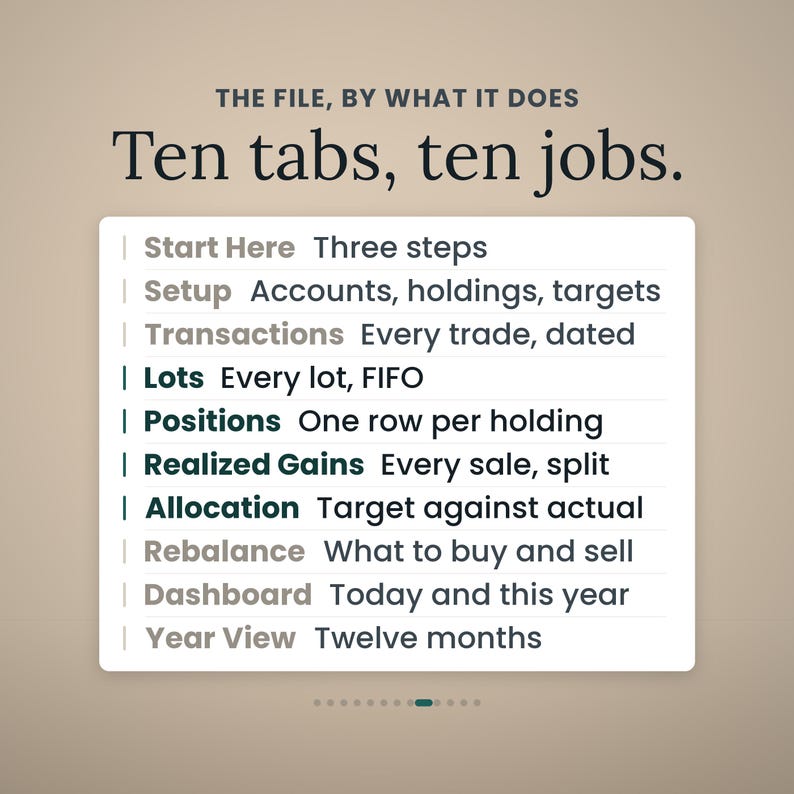
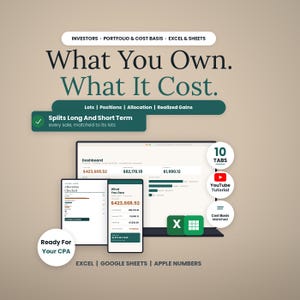
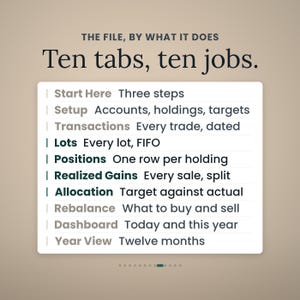
WHAT IS INSIDE (10 TABS)
- Start Here, three steps and you are logging trades
- Setup, your accounts and holdings once: account type and whether a sale in it is taxable, each holding's asset class and expense ratio, your target allocation, your drift band, and the one-year holding rule
- Transactions, one row per buy, sell, dividend, contribution, interest and fee, dated
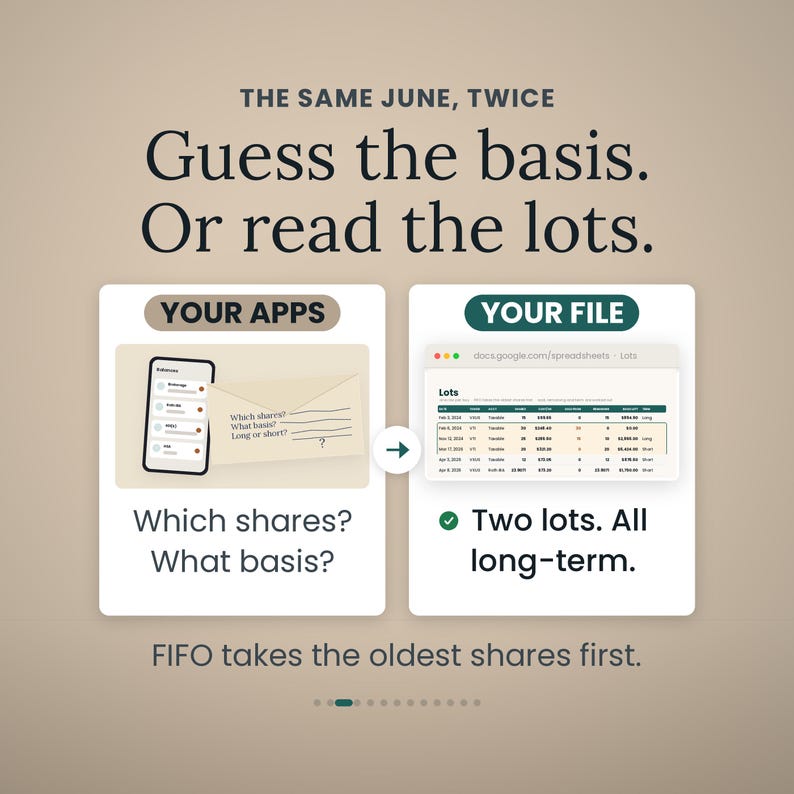
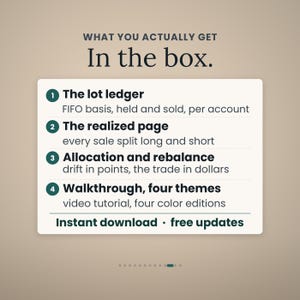
- Lots, one row per buy: what it cost per share, how many shares first-in-first-out has already taken out of that lot, what is left, what the remainder is worth and whether it is long-term or short-term today
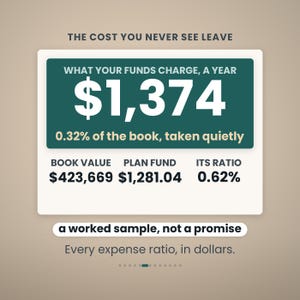
- Positions, one row per holding per account: shares, average cost, basis, market value, unrealized gain, income to date, yield on cost, expense ratio and what that expense ratio costs you a year in dollars
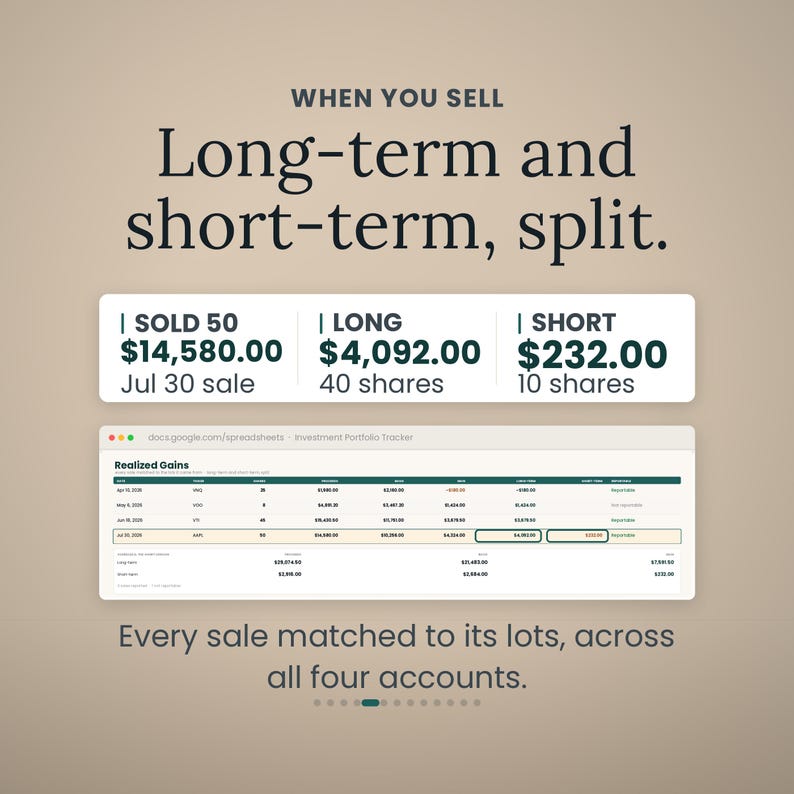
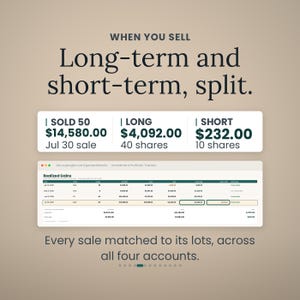
- Realized Gains, every sale matched to the lots it came from with the proceeds, the basis and the gain split long-term and short-term, a reportable flag so a sale inside a Roth or a 401(k) is excluded, and a Schedule D block that adds the columns up
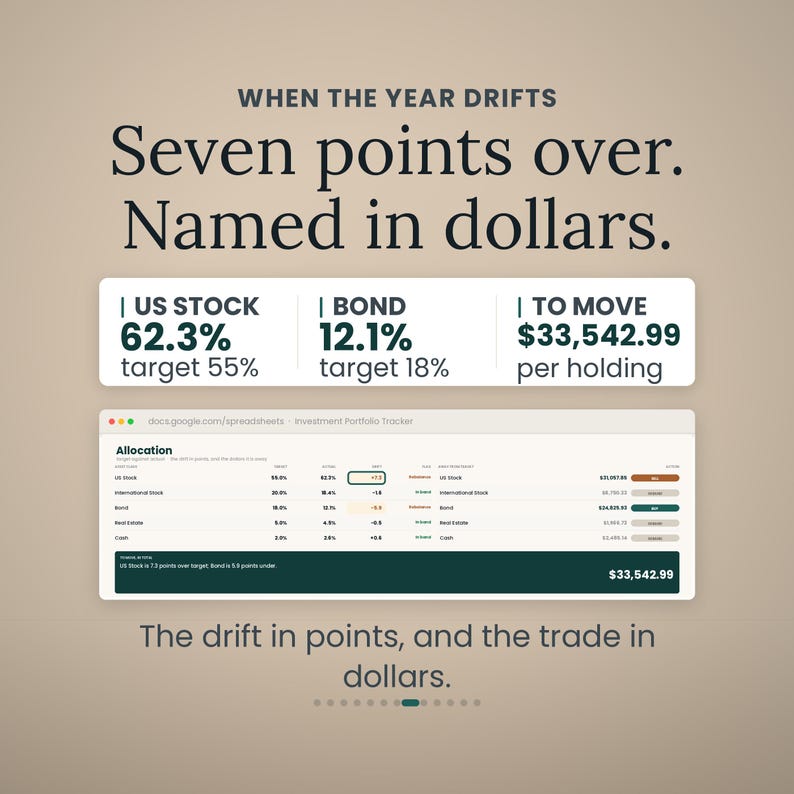
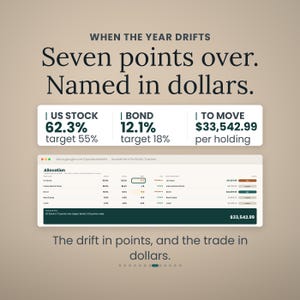
- Allocation, target against actual per asset class, the drift in percentage points and whether each class is inside your band
- Rebalance, the same drift turned into dollars, per class and then per holding, respecting a cash floor you set
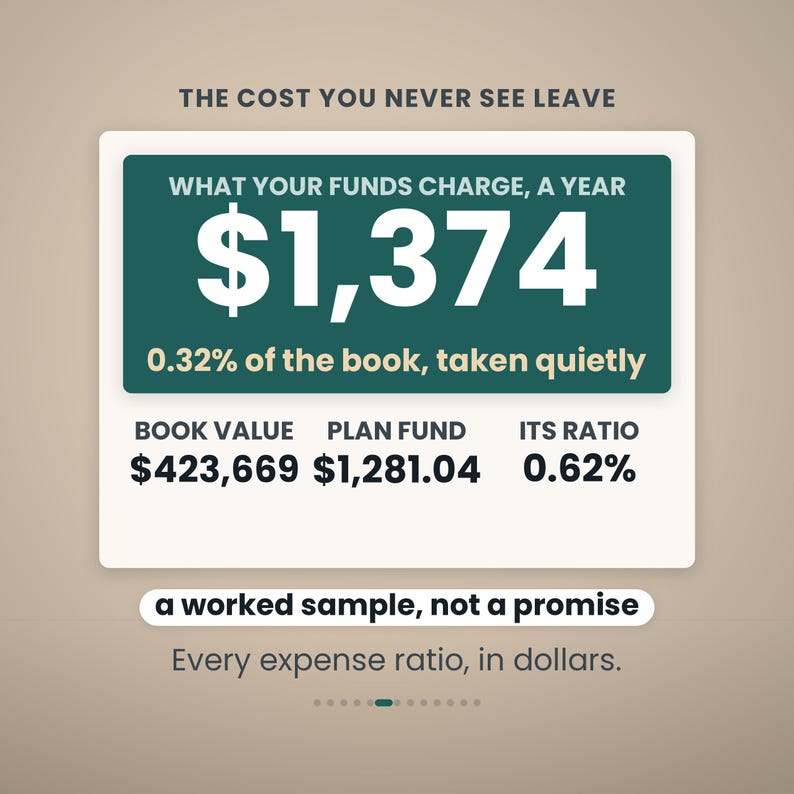
- Dashboard, what the book is worth today, what it has earned, the realized gain split, and the sentence naming what your funds charge you a year
- Year View, twelve rows: contributions, buys, sells, dividends, interest, fees and realized gain, month by month, with two charts
The worked sample inside is an invented four-account household book, January 2024 to August 2026: 289 transactions, 107 lots, four sales, $423,668.52 of market value against $361,492.34 of basis, $7,823.50 of realized gain split $7,591.50 long-term and $232.00 short-term, and a portfolio that has drifted 7.3 points over target on US stock and 5.9 under on bonds. Every share price in it was made up to show the arithmetic. Clear the sample rows and the formulas stay.
THE SALE MOST PEOPLE GET WRONG
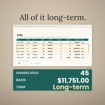
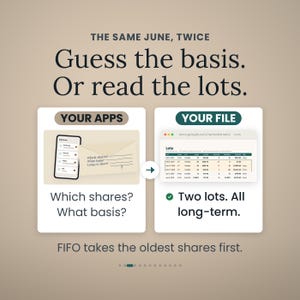
Forty-five shares sold in June for $342.90. Priced against the most recent buy it looks like a $976.50 gain, and it would have looked short-term. Matched to the lots it actually came from, thirty shares from February 2024 and fifteen from November 2024, the basis is $11,751.00 and the gain is $3,679.50, every dollar of it long-term. A $2,703.00 difference on one sale, and a different tax rate.
THE COST NOBODY SEES LEAVE
The Positions tab turns each holding's expense ratio into dollars. In the sample that is $1,374.22 a year, and $1,281.04 of it is a single plan fund charging 0.62 percent. It is not hidden in this file.
WHO IT IS FOR
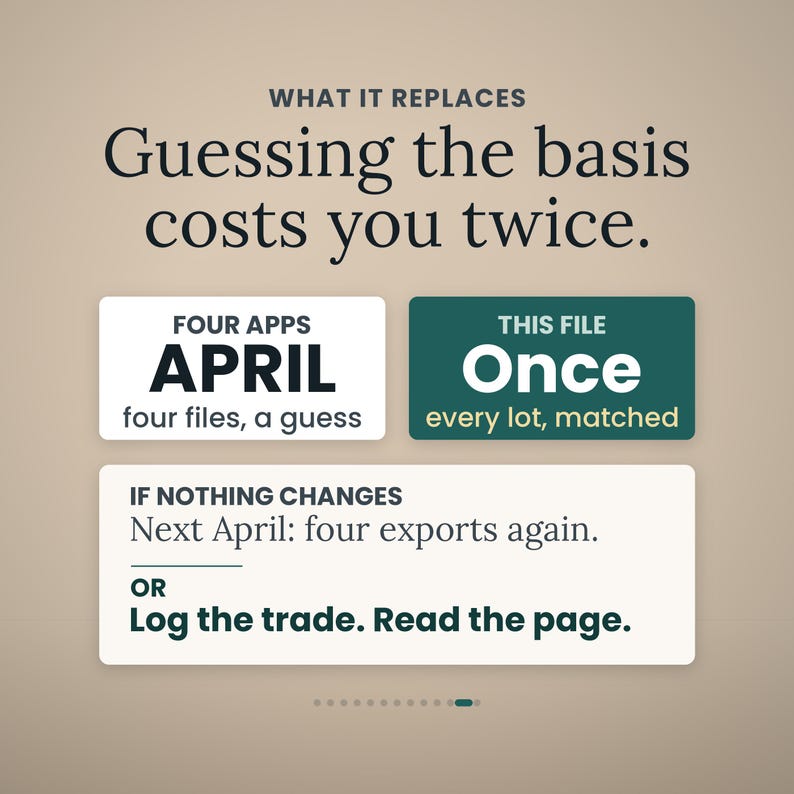
People holding across a taxable brokerage and one or more retirement accounts who do their own records, anyone who has ever tried to work out a cost basis in April from three exports, and anyone who wants the allocation question answered in dollars rather than vibes.
WHAT YOU GET
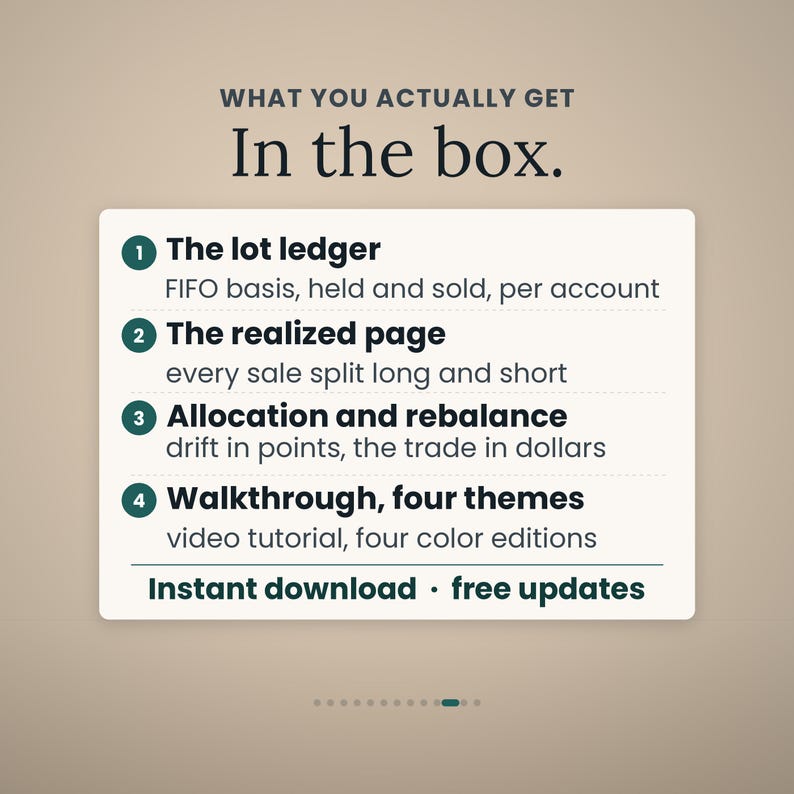
The workbook in four color editions (Colorful, Light, Dark, Editorial) plus a bundle zip, instant download, and a full narrated video walkthrough on YouTube. Free updates.
HOW IT WORKS
Open in Excel, or upload to Google Sheets, or open in Numbers. Fill in Setup with your accounts, holdings and targets. Log each trade. Type one price per holding when you want the book repriced. Read the Realized Gains page before you file and the Allocation page when the year has moved.
WATCH THE TUTORIAL (every tab, narrated, 7 minutes): https://youtu.be/WnrJdcm004A
Digital product, so all sales are final; message me if anything is unclear and I will help.
A record-keeping tool that organizes the trades and prices you enter; not investment, tax, legal or accounting advice, and not a recommendation to buy or hold anything. It matches lots first-in-first-out only, and does not apply specific-identification elections, wash-sale adjustments, foreign tax credits, options, futures, margin or short sales. Your preparer signs the return.
Instant Download
Your files will be available to download once payment is confirmed. Here's how.
Instant download items don’t accept returns, exchanges or cancellations. Please contact the seller about any problems with your order.
Etsy Purchase Protection
Shop confidently on Etsy knowing if something goes wrong with an order, we've got your back for all eligible purchases —
see program terms

Be the first to review this item

Speedy replies Has a history of replying to messages quickly.
Rave reviews Average review rating is 4.8 or higher.
More from this shop
Visit shop-
Digital download
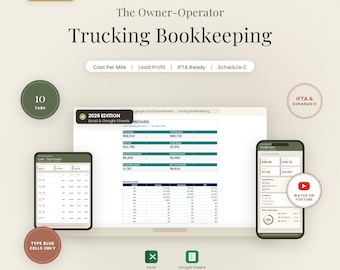
Trucking Owner Operator Bookkeeping Spreadsheet Excel and Google Sheets Cost Per Mile IFTA Load Profit Tracker Schedule C Tax Template
Sale Price $11.68
Original Price $14.97
-
Digital download
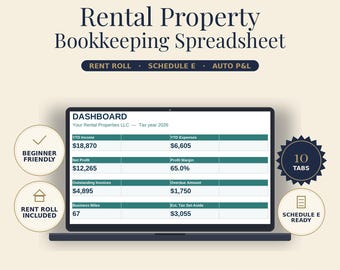
Rental Property Bookkeeping Spreadsheet Excel and Google Sheets Landlord Income Expense Tracker Rent Roll & Schedule E Tax Template
Sale Price $10.12
Original Price $12.97
-
Digital download
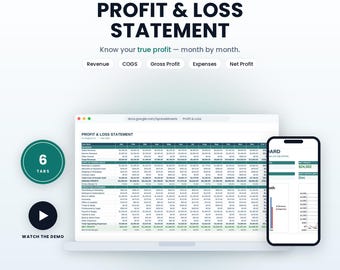
Profit and Loss Statement Template Excel & Google Sheets Small Business Income Statement Monthly and Annual Spreadsheet
Sale Price $10.12
Original Price $12.97
-
Digital download
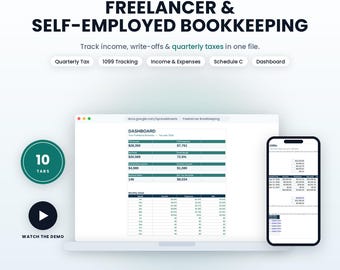
Freelancer Bookkeeping Spreadsheet | Self Employed 1099 Income, Expense and Quarterly Estimated Tax Tracker for Excel and Google Sheets
Sale Price $10.12
Original Price $12.97