



13 Week Cash Flow Forecast Spreadsheet for Small Business, Runway and Break Even Calculator
Price:$18.99
Star Seller
Star Sellers have an outstanding track record for providing a great customer experience—they consistently earned 5-star reviews, shipped orders on time, and replied quickly to any messages they received.
You can only make an offer when buying a single item
Star Seller. This seller consistently earned 5-star reviews, shipped on time, and replied quickly to any messages they received.
Highlights
13-week cash flow forecast spreadsheet for Excel and Google Sheets. See your weekly cash in and out, your runway and your break-even point as a small business.
Your bookkeeper can tell you what happened. Almost nothing tells you what is about to.
This forecasts the next thirteen weeks of cash, week by week, from the invoices you are owed, the bills you owe, your payroll and your overheads. Then it answers the two questions that actually decide things: can I make payroll, and when do I run out.
WHAT YOU GET
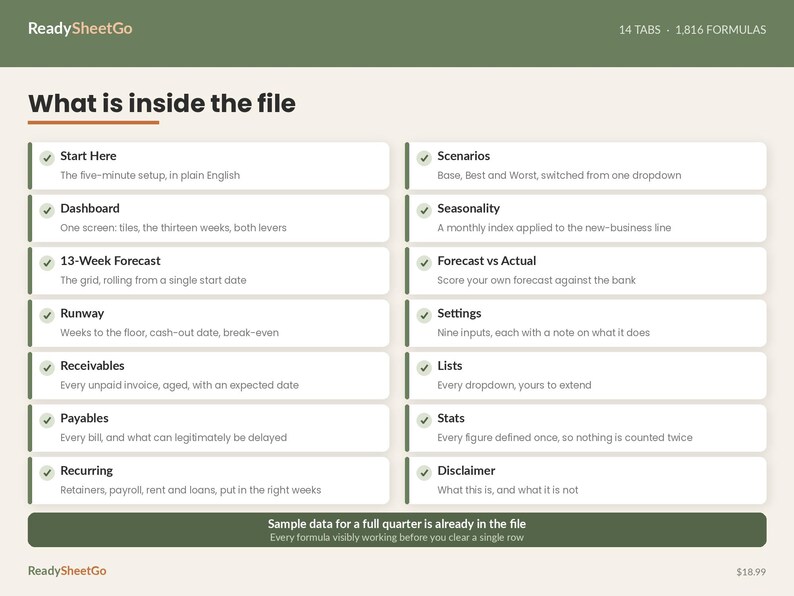
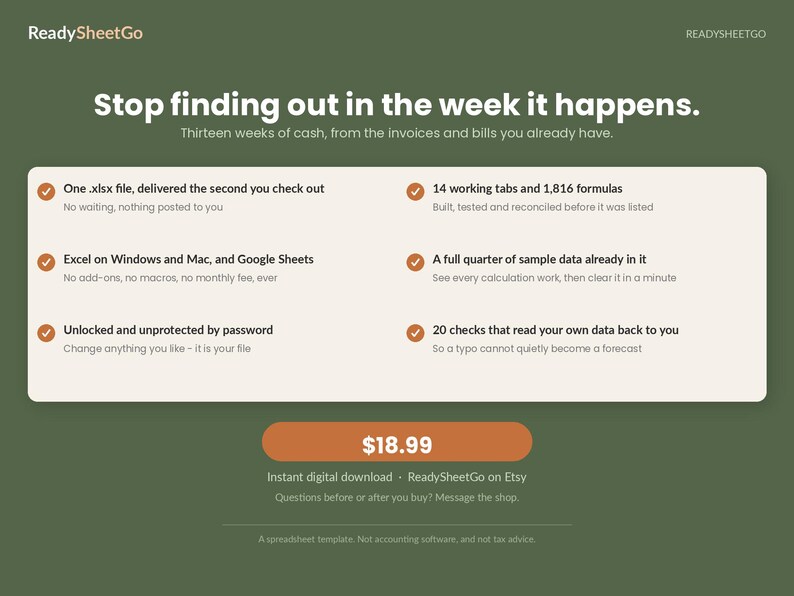
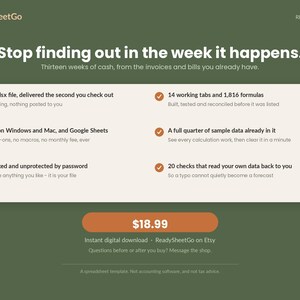
14 tabs and 1,816 working formulas in a single .xlsx file. Download it, open it, and a full quarter is already forecast on sample data, so you can watch every calculation work before you clear a single row.
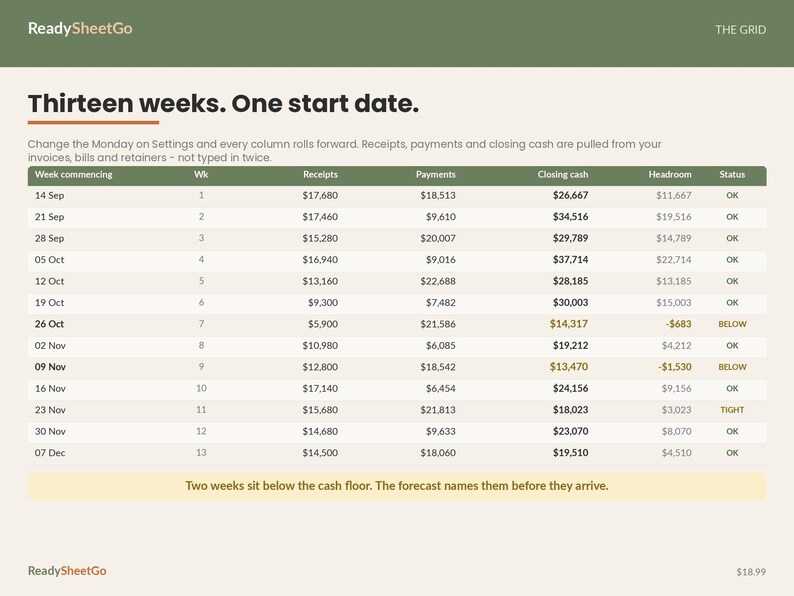
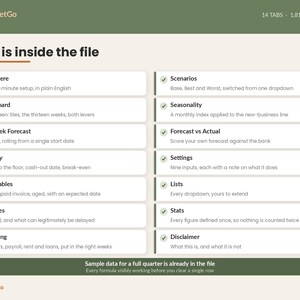
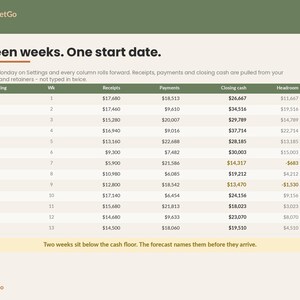
- 13-Week Forecast -- the grid. Opening cash, every receipt, every payment, closing cash and the headroom above your floor, in thirteen columns built from ONE start date. Move that date and the whole model rolls forward instead of going stale.
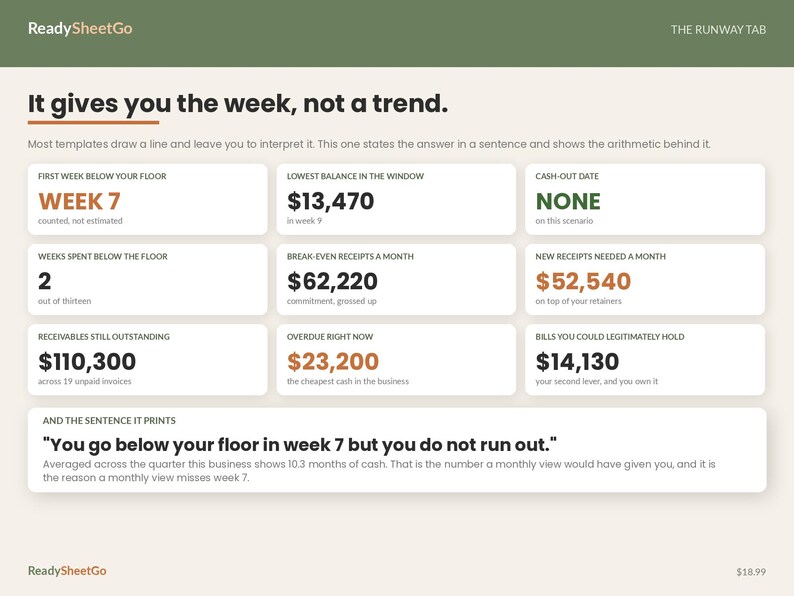
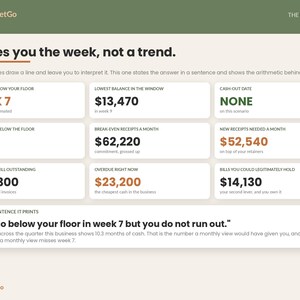
- Runway -- the answers in plain numbers. The first week you drop below your cash floor, the date you run out if nothing changes, your lowest balance and the week it lands in, and the revenue you need each month to break even.
- Receivables -- every unpaid invoice, aged into Current, 1-30, 31-60, 61-90 and 90+, with a days sales outstanding figure and an expected pay date that drives the forecast.
- Payables -- every bill you owe, with a Can Delay flag and a Delay In Weeks column. Push a bill out by two weeks and watch all thirteen columns re-forecast.
- Recurring -- retainers, payroll, rent, software and loan repayments. Set the amount and the frequency and the workbook works out which of the thirteen weeks each one lands in, including fortnightly runs and quarterly bills.
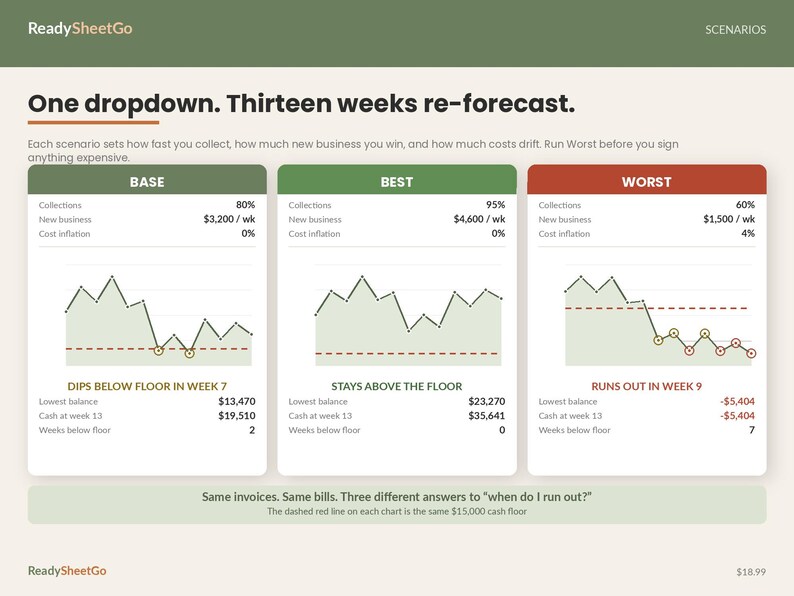
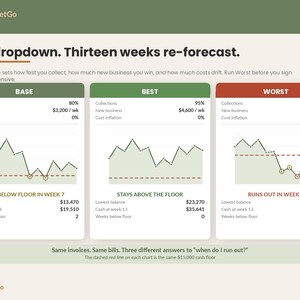
- Scenarios -- Base, Best and Worst. Each sets how fast you collect, how much new business you win per week and how much costs drift. One dropdown on Settings re-forecasts the entire grid.
- Seasonality -- a monthly index applied to the new-business line, because August is not March.
- Forecast vs Actual -- enter what really happened each week and the workbook scores its own accuracy and tells you whether you forecast optimistically.
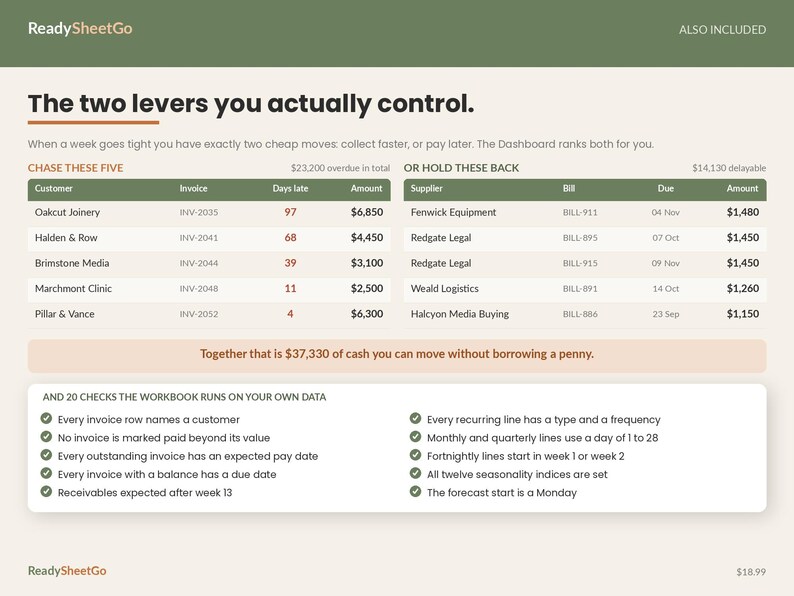
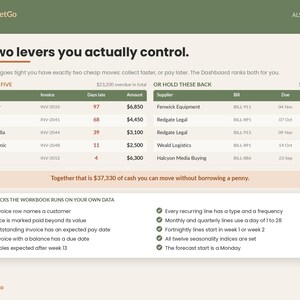
- Dashboard -- one screen. Headline tiles, the thirteen weeks, the five oldest invoices to chase, the largest bills you could legitimately hold, and 20 checks run on your own data.
- Start Here, Settings, Lists, Stats and a Disclaimer round it out.
THE THING A MONTHLY VIEW MISSES
On the sample data this business shows 10.3 months of cash on its average burn. That is the comforting number a monthly view gives you. The weekly grid shows it dropping below its cash floor in WEEK 7 -- because a quarter is not smooth, and payroll does not wait for the average. Switch the same file to the Worst scenario and it runs out of money in week 9. Same invoices, same bills, three different answers.
THE TWO LEVERS, RANKED FOR YOU
When a week goes tight there are exactly two cheap moves: collect faster, or pay later. The Dashboard ranks your five oldest unpaid invoices by how late they are, and your largest genuinely delayable bills by size, and totals what moving both would free up. On the sample data that is $37,330 of cash without borrowing a penny.
HOW THE COLLECTIONS MODEL WORKS
This is the one assumption worth understanding before you buy. In any week, the scenario's collections rate is the share of that week's expected receivables that actually lands. The remainder slips forward exactly one week and is collected then. It is deliberately a one-week slip rather than a decay curve, because a model you can explain to your accountant in one sentence is one you will actually keep using.
IT CHECKS YOUR WORK
20 checks read your own data back to you on the Dashboard: an invoice with no expected pay date, an invoice marked paid beyond its value, a bill held back that you flagged as one that cannot be delayed, a monthly line set to the 31st that would fire twice in a thirty-day month, a start date that is not a Monday, a scenario name that matches nothing. Each one names the tab and the problem in words, not a code.
HOW IT WORKS
1. Settings. Your business name, the MONDAY the forecast starts, the cash actually in the bank that morning, and your minimum cash floor. Everything else has a sensible default.
2. Receivables. One row per unpaid invoice. The column that does the work is EXPECTED PAY DATE, not the due date.
3. Payables. One row per bill, and mark what could be delayed if it had to be.
4. Recurring. Your retainers, payroll, rent and loans, with a frequency each.
5. Read the Runway tab. Then check yourself against the bank each week on Forecast vs Actual.
COMPATIBILITY
Microsoft Excel on Windows and Mac, Google Sheets, and Excel on iPad. Every formula is supported by Google Sheets exactly as written. No add-ons, no macros, no subscription. To use it in Sheets: File, Import, Upload, then Replace spreadsheet.
Formula cells are protected so a stray paste cannot break a calculation. There is no password -- unprotect any sheet from the Review menu and change anything you like. Rows can be inserted and sorted as shipped; columns are blocked, because a mid-sheet column insert silently breaks cross-sheet references.
WHAT YOU RECEIVE
One .xlsx file, delivered as an instant download after checkout. Nothing is posted to you.
PLEASE READ
This is a spreadsheet template -- a forecasting tool and a record. It is not accounting software, it is not a bookkeeping system, and it is not financial or tax advice. A cash flow forecast is arithmetic applied to assumptions YOU supply: the collections rate, the new-business figure and the expected pay date on every invoice are your estimates, not facts. It will state a wrong answer confidently if you feed it wrong inputs, which is exactly why the Forecast vs Actual tab exists. The tax set-aside line is a simple percentage of receipts so that you do not spend money that is not yours; it is not a tax calculation and knows nothing about your jurisdiction or your rates. Speak to an accountant about that. Break-even figures put the window on a monthly footing at 4.345 weeks per month, which is a convention and will differ from an accruals profit and loss -- this workbook models CASH, which is deliberately not the same thing as profit.
Questions before or after you buy? Message ReadySheetGo through Etsy and we will answer.
———————————————
VIDEO TUTORIAL INCLUDED
This template comes with a step-by-step video walkthrough to help you get set up in minutes. Your tutorial link is included with the instant download.
Instant Download
Your files will be available to download once payment is confirmed. Here's how.
Instant download items don’t accept returns, exchanges or cancellations. Please contact the seller about any problems with your order.
Etsy Purchase Protection
Shop confidently on Etsy knowing if something goes wrong with an order, we've got your back for all eligible purchases —
see program terms

Be the first to review this item


Speedy replies Has a history of replying to messages quickly.
Rave reviews Average review rating is 4.8 or higher.
More from this shop
Visit shop-
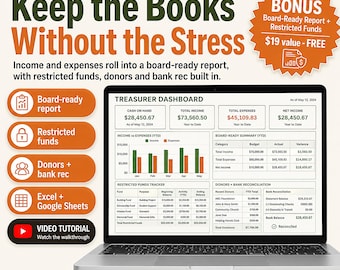
Digital download
Nonprofit Church Treasurer Spreadsheet Template Excel Google Sheets | Donation Tracker, Restricted Fund and Budget Board Report Dashboard
$18.99
-
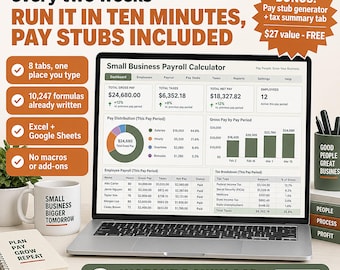
Digital download
Small Business Payroll Calculator Spreadsheet Template Excel Google Sheets | Pay Stub Generator, Employee Paycheck and W-2 Tax Tracker
$19.99
-
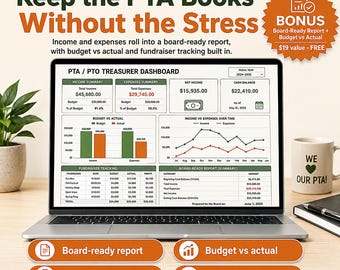
Digital download
PTA Treasurer Spreadsheet | Budget, Bank Reconciliation, Fundraiser Tracker (Excel, Google Sheets)
$18.99
-
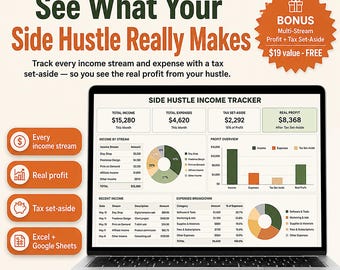
Digital download
Side Hustle Income Tracker Spreadsheet 2027, Multiple Income Streams & Expense Log | Freelance Profit Loss Tax Estimator, Google Sheets
$14.99
-

Digital download
13-Week Cash Flow Forecast Template | Cash Budget Spreadsheet | CFO Cash Visibility Starter Kit (Small Business)
$16.99
-

Digital download
13 Week Cash Flow Forecast Excel Template
$12.50
-

Digital download
Bundle: Weekly & Daily Cash Flow Template for Small Business
$11.99
-

Digital download
Cashflow Forecast Sheet - Excel and Google Sheet | Financial Planning & Cash Flow Management | Budget Forecast Template
Sale Price $5.74
Original Price $11.48
-

Digital download
Cash Flow Forecast Template Sheets | Cash Flow Projection Template | Cash Flow Forecast Template 2 Year | Blank Cash Flow Forecast Template
$16.00
-

Digital download
Cash Flow Forecast Excel Template Bookkeeping Financial Planning Dynamic Dashboard Digital Download
$11.70
-
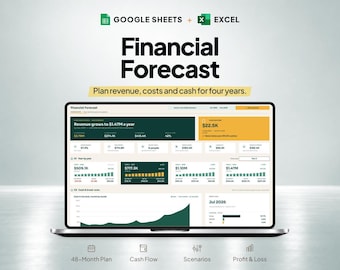
Digital download
Small Business Planner, Cash Flow Template, Financial Forecast Google Sheets Excel, 4-Year Profit and Loss, Business Plan Spreadsheet
Sale Price $7.50
Original Price $15.00
-

Digital download
13 Week Cash Flow Forecast Template | Excel Google Sheets | Weekly Cash Flow Tracker | Small Business Budget Financial Model
$25.87
-

Digital download
2-Year Cash Flow Forecast Google Sheets Template | Financial Projection Business Cash Flow Spreadsheet Template | Profit Analysis Projection
$11.00
-

Digital download
Cash Flow Management Spreadsheet in Excel with Daily and Monthly Tracking Dashboards
$13.00
-
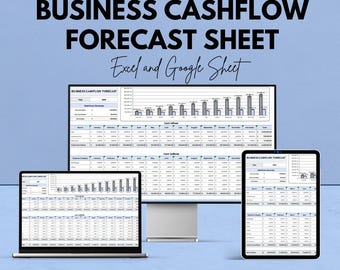
Digital download
Business Cashflow Forecast Sheet - Excel and Google Sheet Template for Budgeting, Expense & Income Planning - Small Business Finance Tool
Sale Price $5.74
Original Price $11.48
-
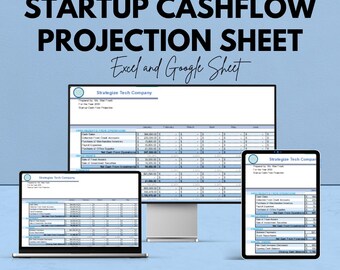
Digital download
Startup Cash Flow Projection Template | Google Sheets & Excel | Business Cashflow Forecast | Monthly Finance Planner | Editable Spreadsheet
Sale Price $5.74
Original Price $11.48
Shoppers with similar taste loved these
-
Digital download
Etsy Shop Kit Bundle, Editable Canva, Etsy Shop Banner Templates, Product Listing Photos Mockup, Etsy Store Modern Branding Kit, Etsy Seller
Sale Price $29.26
Original Price $58.52
-

Digital download
Florist Proposal Bundle, Editable Canva Templates, 3 Floral Design Proposals, Flower Mood Boards, Wedding Florist Presentation Templates
$36.99
-

Digital download
Business Plan Template Printable | Small Business Planner | Start Up Workbook | Side Hustle Planner | Canva Template
Sale Price $5.25
Original Price $15.00
-

Digital download
Branding Planner Workbook: 40-Page Brand Strategy Guide (PLR)
Sale Price $3.38
Original Price $8.45
-

Digital download
Ultimate Notion Wedding Planner Template | Digital Wedding Organizer with Budget, Guest List, Seating Chart, Timeline, Checklist & More
$31.68
-
Digital download
Services & Pricing Guide Canva Template for Coaches, Designers, Consultants, Creatives Elegant Burgundy
Sale Price $9.67
Original Price $12.90
-

Digital download
Old Money Ebook Template (Canva Lead Magnet Guide)
Sale Price $12.88
Original Price $18.40
-

Digital download
Client Welcome Packet Canva Template | Onboarding Guide, Brand Handbook, Elegant Classic Red Burgundy
Sale Price $7.35
Original Price $9.80
-
Digital download
Etsy Shop Kit Bundle, Editable Canva, Etsy Shop Banner Templates, Product Listing Photos Mockup, Etsy Store Modern Branding Kit, Etsy Seller
Sale Price $29.26
Original Price $58.52
-

Digital download
Coaching Intake Form Canva Template, Client Intake Questionnaire, Client Onboarding Form, Editable Printable PDF for Coaches
Sale Price $3.16
Original Price $7.90
-
Digital download
Burgundy Invoice Template for Coaches and Freelancers, Editable in Canva, A4 and US Letter
Sale Price $1.96
Original Price $4.90
-

Digital download
Business Planner Bundle: 80+ Printable Worksheets, Canva Template (MRR PLR Bundle, Digital Download)
Sale Price $4.22
Original Price $10.56


