





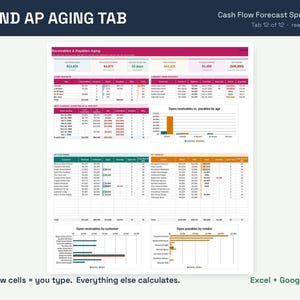
Cash Flow Forecast Spreadsheet, Business KPI Dashboard, 12 Month Plan, Small Business Cash Flow, Financial Dashboard, Excel Google Sheets
NowPrice:$5.99
Original Price: $11.99
50% off
Sale ends on November 22
You can only make an offer when buying a single item
Highlights
Cash Flow Forecast Spreadsheet for Microsoft Excel and Google Sheets, instant digital download. See your next 12 months of cash, get warned before your balance drops too low, and track the KPIs that matter. Perfect for small business owners and shop owners.
🎥 WATCH THE FULL WALKTHROUGH VIDEO before you buy, every tab explained: https://youtu.be/WNlyegLgND8
✨ NOW INCLUDES 4 FILES: a SAMPLE version (filled in so you can see exactly how it works) and a BLANK version (cleared and ready for your own info), each in an Excel edition and a Google Sheets edition.
★ WHAT'S INCLUDED ★
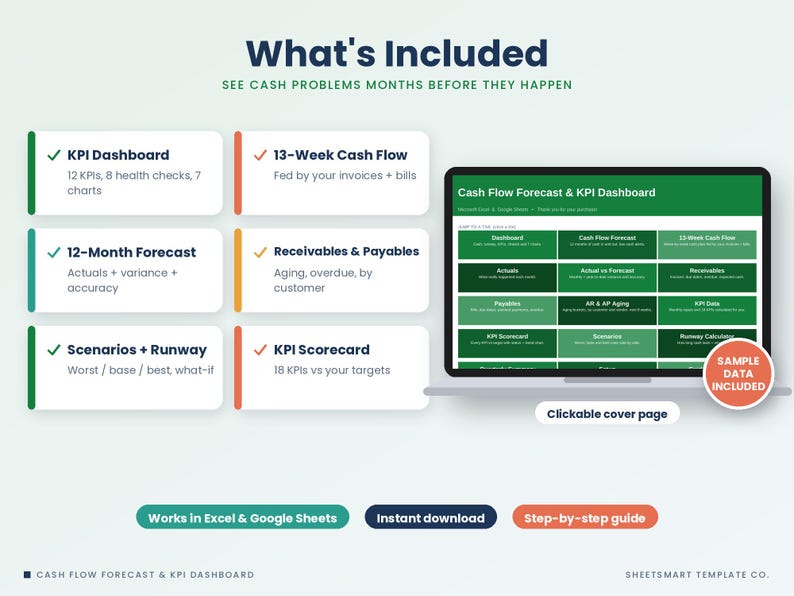
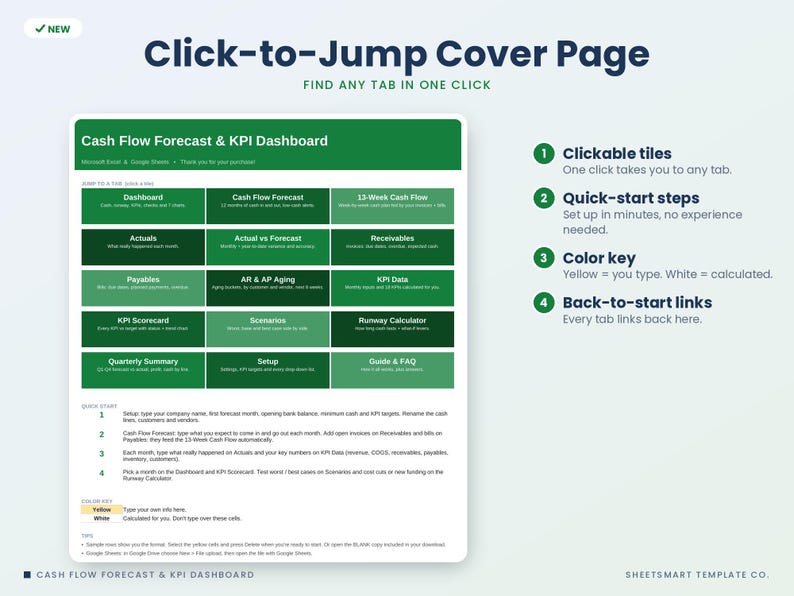
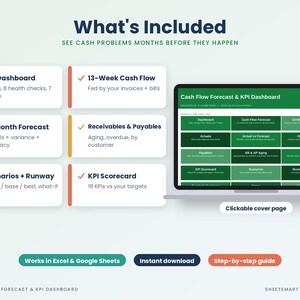
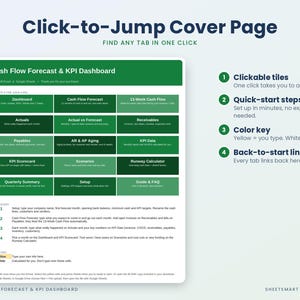
• Clickable Start Here cover page with quick-start steps and a color key
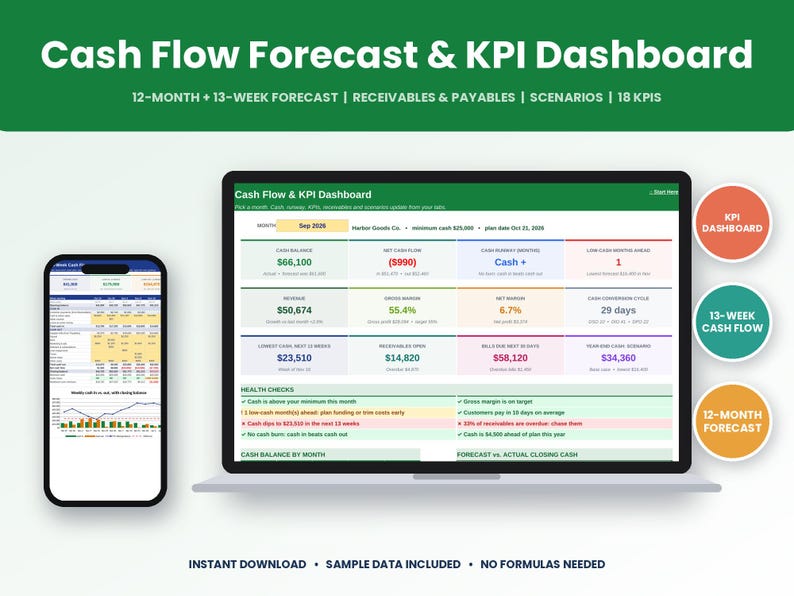
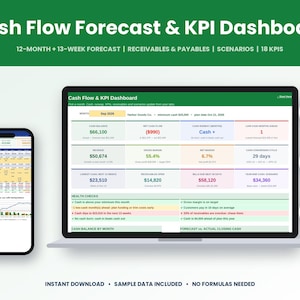
• Cash Flow & KPI Dashboard: pick any month for 12 KPI tiles (cash balance, net cash flow, runway, low-cash months ahead, revenue, gross margin, net margin, cash conversion cycle, lowest cash in the next 13 weeks, open receivables, bills due in the next 30 days, year-end cash for your chosen scenario), 8 automatic health checks, a cash-by-month table, a monthly KPI table and 7 charts
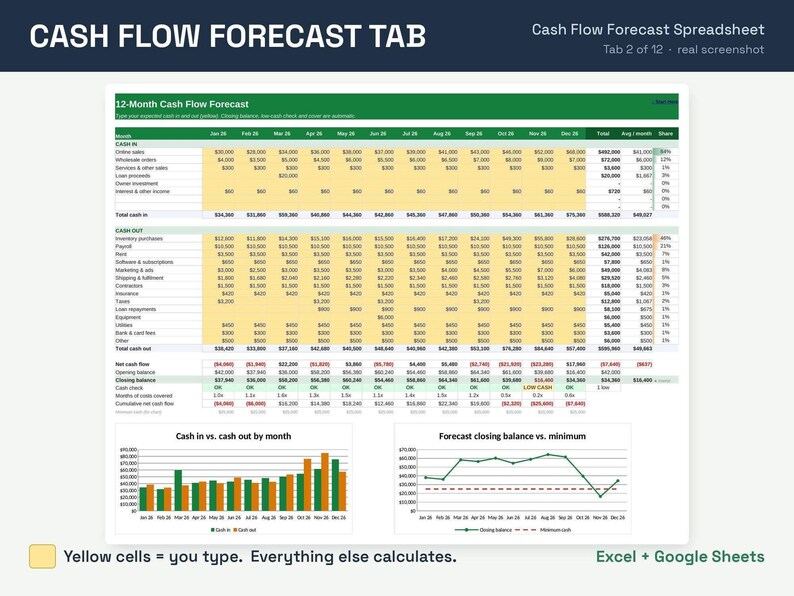
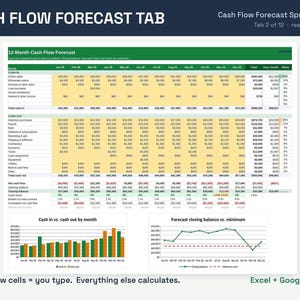
• 12-Month Cash Flow Forecast: 8 cash-in and 14 cash-out lines (all renameable), closing balance, low-cash and overdrawn alerts, months of costs covered, cumulative cash flow, average per month and share of total, with 2 charts
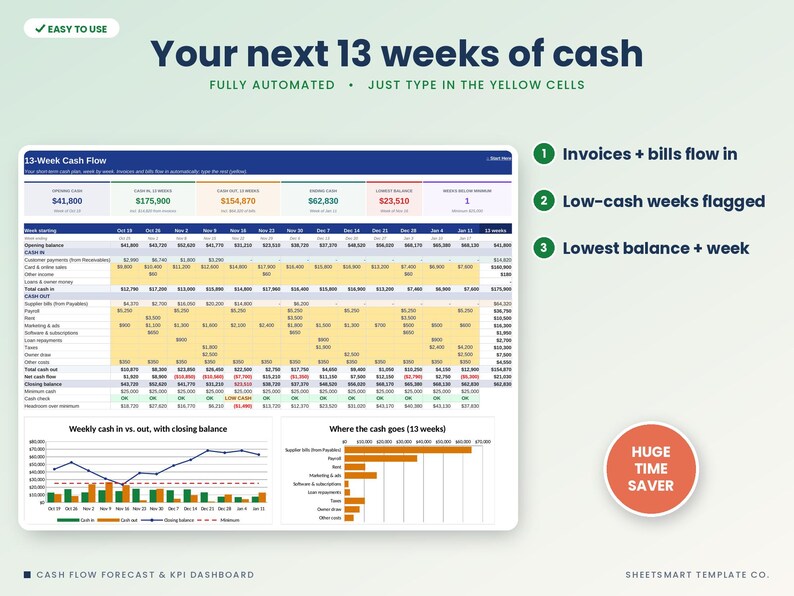
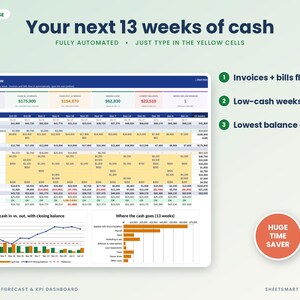
• 13-Week Cash Flow: a week-by-week plan that pulls customer payments from Receivables and supplier bills from Payables automatically, plus your own weekly lines (payroll, rent, taxes, owner draw and more), lowest balance and low-cash weeks flagged, with 2 charts
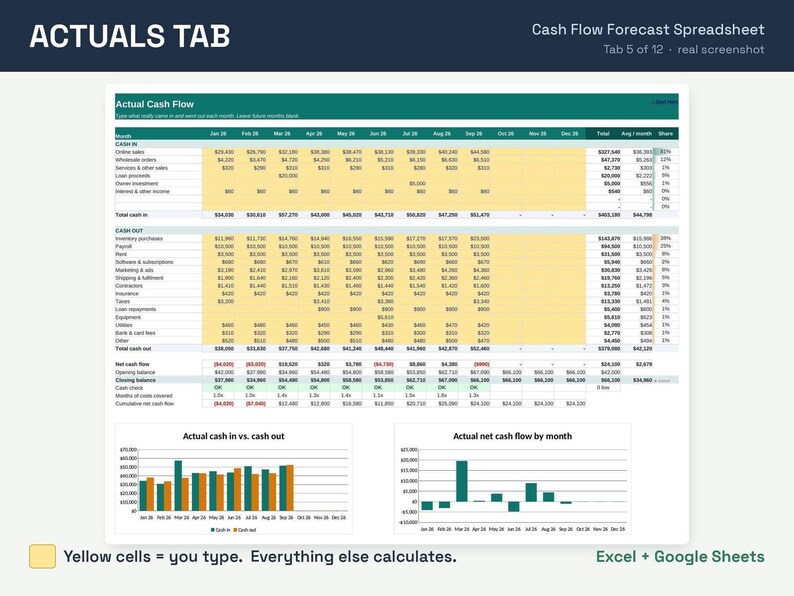
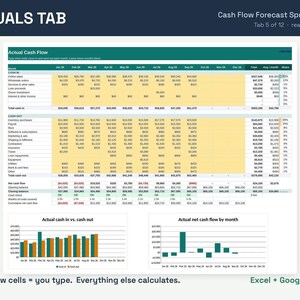
• Actuals: the same layout for what really happened each month, with 2 charts
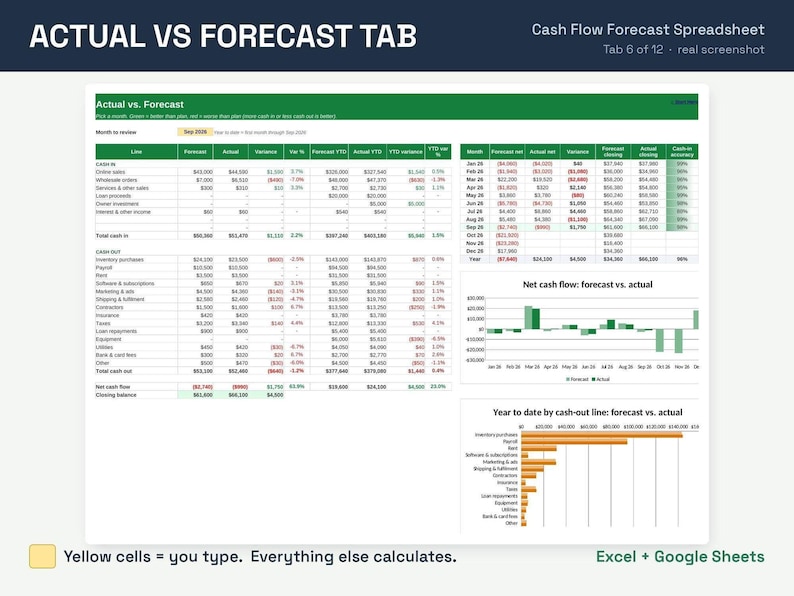
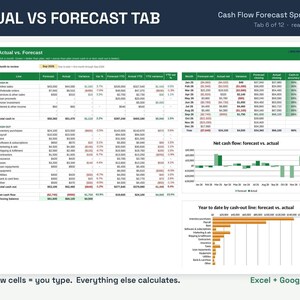
• Actual vs Forecast: pick a month for variance and year-to-date variance on every line (green = better than plan, red = worse), a monthly forecast accuracy table and 2 charts
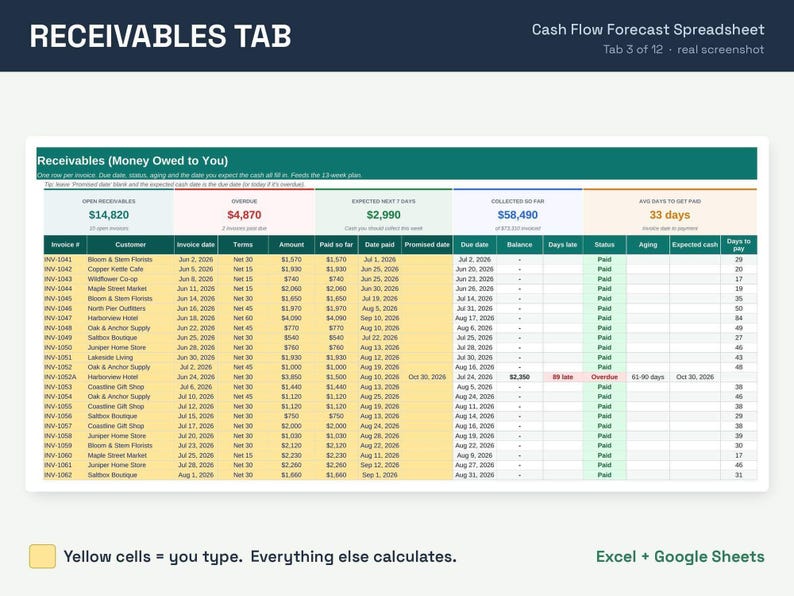
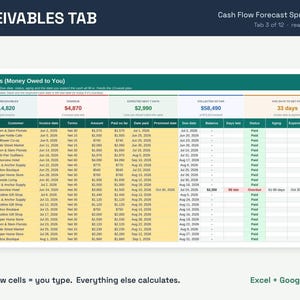
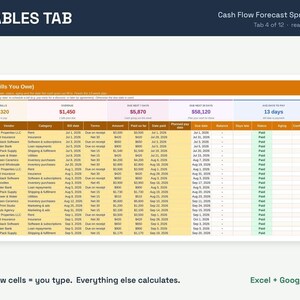
• Receivables: 300-row invoice log with customer and payment-terms drop-downs, automatic due date, balance, days late, paid / due soon / part paid / overdue status, aging bucket and expected cash date
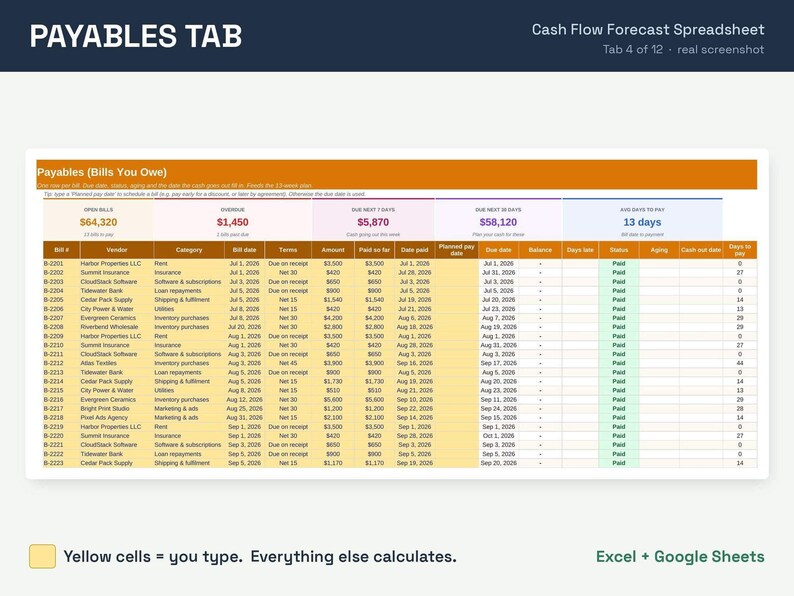
• Payables: 300-row bill log with vendor, category and terms drop-downs, planned pay date, due date, balance, scheduled / overdue status, aging bucket and cash-out date
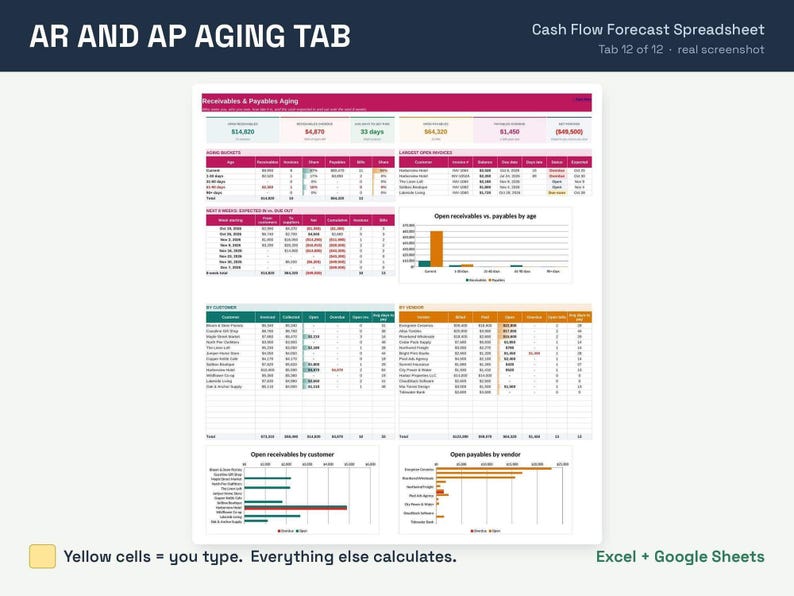
• AR & AP Aging: receivables and payables by age (current to 90+ days), largest open invoices, money in vs. out for the next 8 weeks, totals by customer and by vendor, and 3 charts
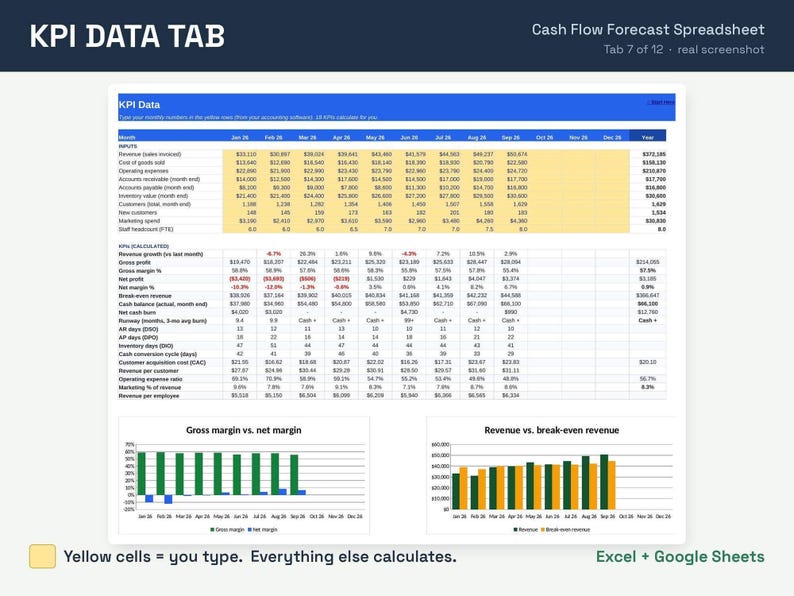
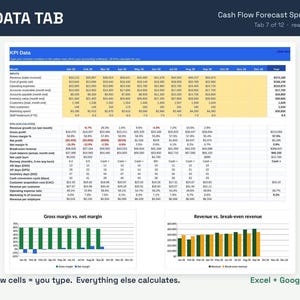
• KPI Data: type 10 monthly numbers and get 18 KPIs: revenue growth, gross profit and margin, net profit and margin, break-even revenue, cash balance, cash burn, runway, DSO, DPO, DIO, cash conversion cycle, CAC, revenue per customer, operating expense ratio, marketing % of revenue and revenue per employee, with 2 charts
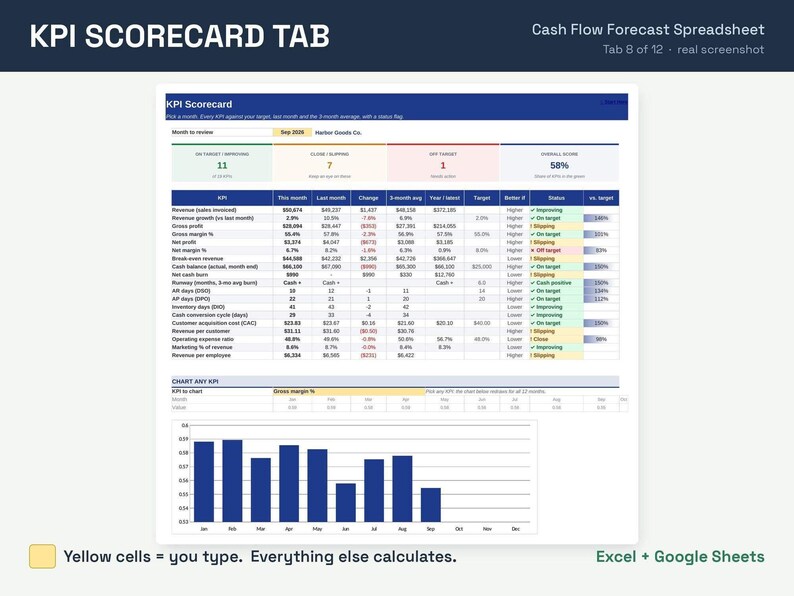
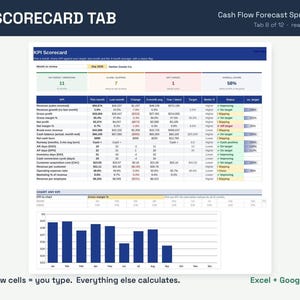
• KPI Scorecard: every KPI for the month you pick vs. last month, the 3-month average and your target, with on target / close / off target flags, progress bars and a chart of any KPI you choose
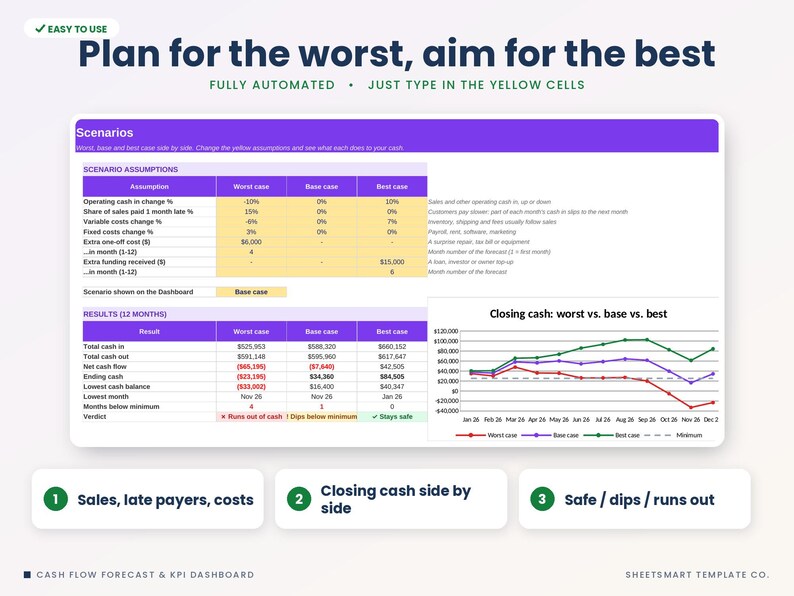
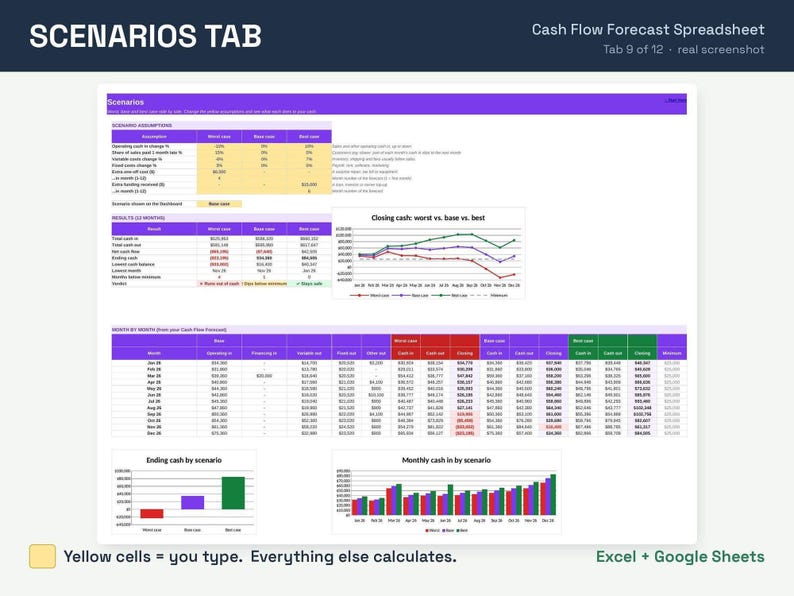
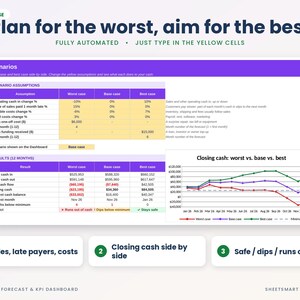
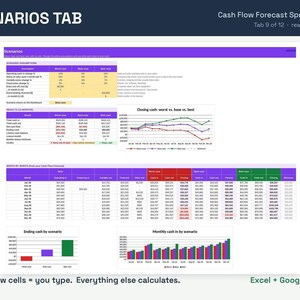
• Scenarios: worst, base and best case side by side (sales up or down, customers paying late, variable and fixed cost changes, a one-off cost, new funding) with ending cash, lowest cash, months below minimum, a verdict and 3 charts
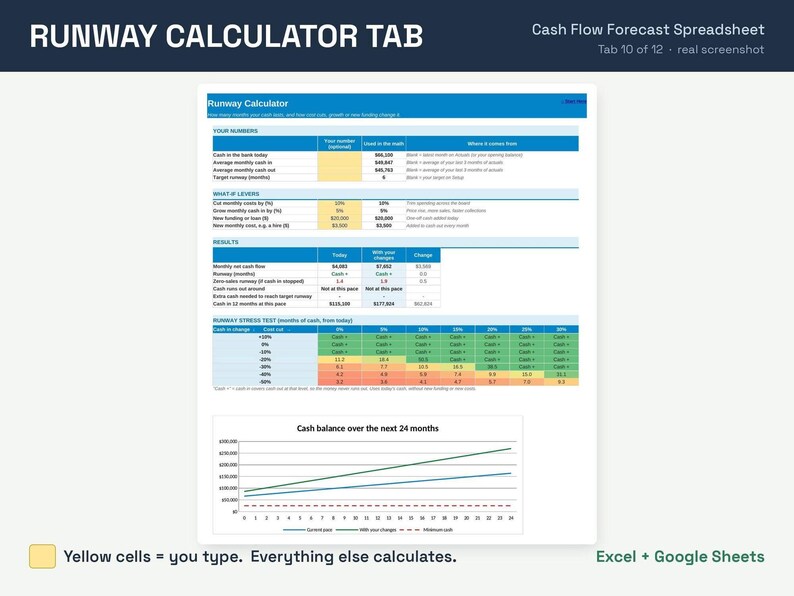
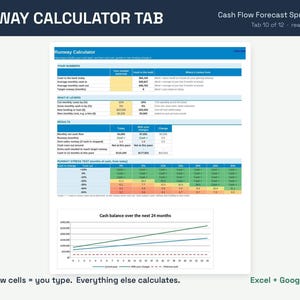
• Runway Calculator: runway today and with cost cuts, growth, new funding or a new hire, zero-sales runway, cash needed to reach your target runway, a 7 x 7 runway stress test and a 24-month cash chart
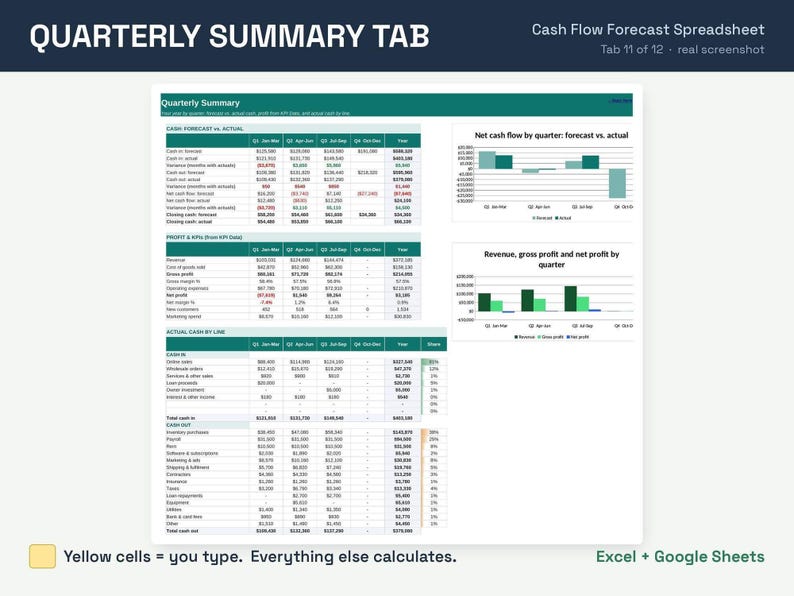
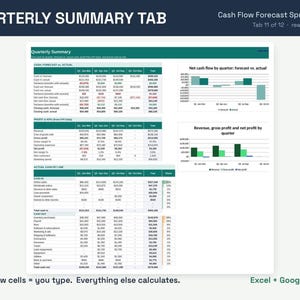
• Quarterly Summary: Q1-Q4 forecast vs. actual cash, quarterly profit from KPI Data and actual cash by line, with 2 charts
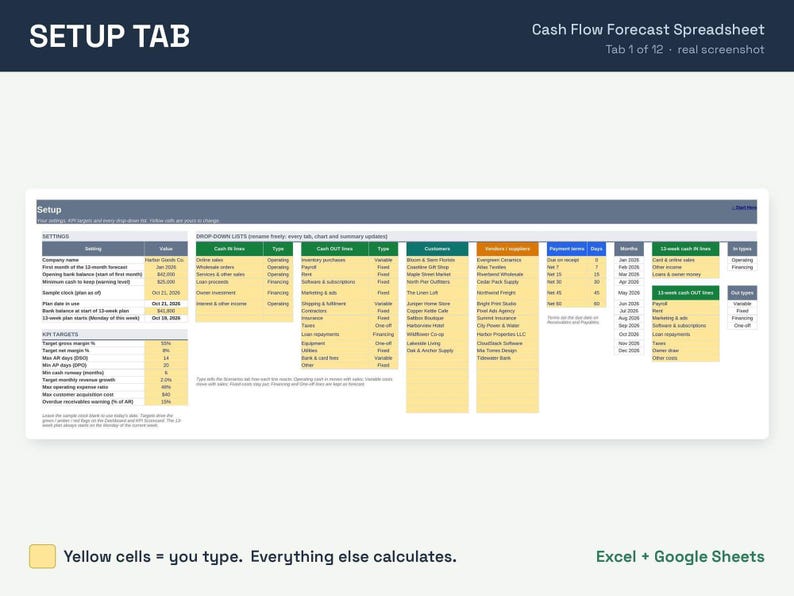
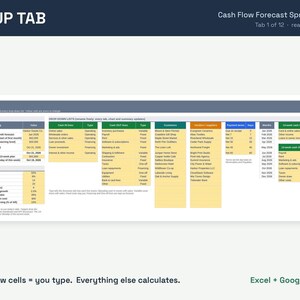
• Setup: company name, first forecast month, opening cash, minimum cash, 9 KPI targets, cash line names and types, customers, vendors and payment terms (all renameable)
• Guide & FAQ with step-by-step instructions and plain-English explanations of DSO, DPO, DIO, runway and the cash conversion cycle
• 2 versions of each file: one with sample data to show how it works and one blank, ready to use
★ PERFECT FOR ★
✓ Small business owners and shop owners
✓ Ecommerce and wholesale businesses
✓ Bookkeepers preparing monthly reviews
✓ Anyone who wants to stop guessing about cash
★ COMPATIBILITY ★
• Microsoft Excel (desktop, Mac, web)
• Google Sheets (upload to Google Drive and open with Google Sheets)
• Not designed for Apple Numbers
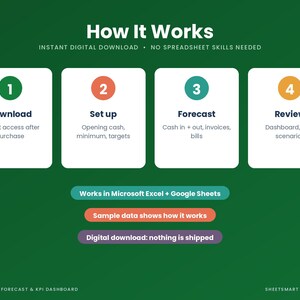
★ HOW IT WORKS ★
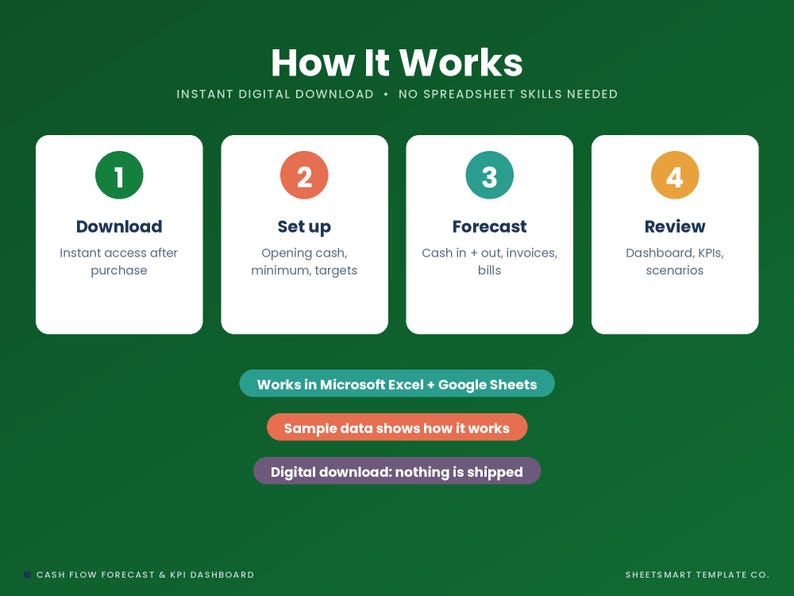
1. Enter your start month, opening bank balance and minimum cash on Setup
2. Type your expected cash in and out for 12 months
3. Each month, add your actuals and KPI numbers
4. Review the Dashboard and Actual vs Forecast
Works in any currency ($, £, €, C$, A$ and more): just change the currency symbol.
★ PLEASE NOTE ★
• This is a digital download. Nothing will be shipped.
• This is a planning tool, not financial, tax or accounting advice.
• Because it's a digital file, returns aren't accepted, but if you have any trouble with the file, message me and I'll fix it or help you right away.
Instant Download
Your files will be available to download once payment is confirmed. Here's how.
Instant download items don’t accept returns, exchanges or cancellations. Please contact the seller about any problems with your order.
Etsy Purchase Protection
Shop confidently on Etsy knowing if something goes wrong with an order, we've got your back for all eligible purchases —
see program terms

Be the first to review this item


More from this shop
Visit shop-
Digital download
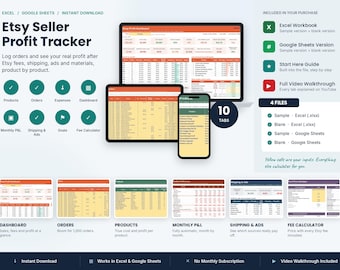
Etsy Seller Spreadsheet, Fee Calculator and Profit Tracker, Shop Dashboard, Excel Google Sheets
Sale Price $3.99
Original Price $7.99
-
Digital download
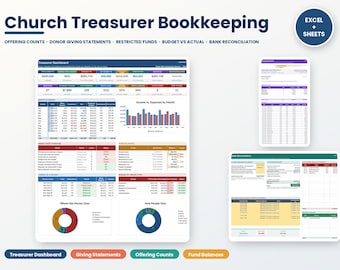
Church Treasurer Spreadsheet, Excel and Google Sheets, Nonprofit Bookkeeping, Donation Tracker, Giving Statements, Fund Accounting
Sale Price $9.99
Original Price $19.99
-
Digital download
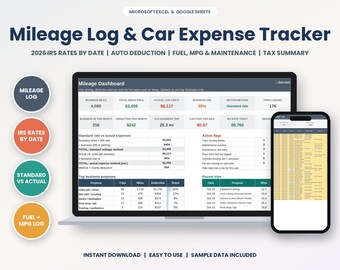
Mileage Log Spreadsheet 2026, IRS Rate Tracker, Car Expense Tax Deduction, Mileage Tracker, Business Mileage Log, Excel Google Sheets
Sale Price $2.99
Original Price $5.99
-
Digital download
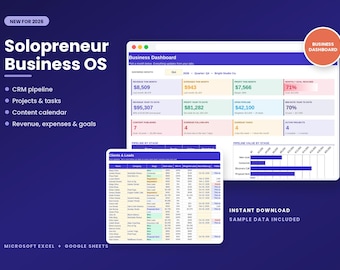
Solopreneur Business Planner Spreadsheet, CRM, Project Tracker, Content Calendar, Small Business Planner, Excel Google Sheets
Sale Price $12.49
Original Price $24.99
-
Digital download
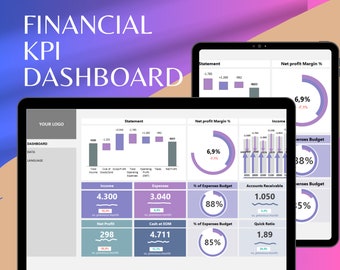
Financial KPI Dashboard Excel | Multi-Language | Income, Profit, Cash Flow, AR, AP Tracker | Monthly Financial Performance Monitor
Sale Price $10.50
Original Price $15.00
-
Digital download
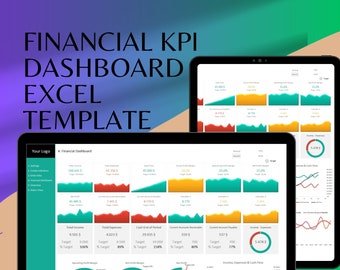
Financial KPI Dashboard Excel Template | Income, Profit Margin, Cash Flow, AR, AP Tracker | Business Performance Monitor | Multi-Theme
Sale Price $13.99
Original Price $19.99
-

Digital download
Cash Flow Forecast Excel Template Bookkeeping Financial Planning Dynamic Dashboard Digital Download
$11.89
-
Digital download
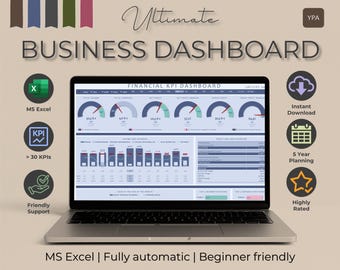
KPI Dashboard Excel Template • 5-Year Business Metrics & Multi-Currency Tracking • 30+ KPIs • Instant Download
Sale Price $12.15
Original Price $18.69
-

Digital download
Forecast Dashboard Excel Template, Income Expense Tracker, Business Projection Sheet, Excel
$11.11
-

Digital download
Startup Cash Flow Forecast: Excel Dashboard Template (Digital Download)
$11.11
-
Digital download
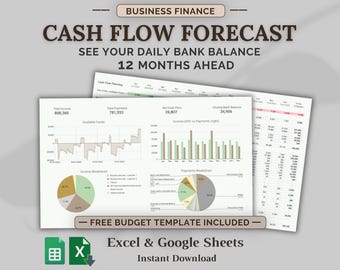
12-Month Business Cash Flow Forecast Spreadsheet | Daily Bank Balance Planner (Excel & Google Sheets)
$29.07
-

Digital download
Cash Flow Dashboard Excel Template: Financial Analysis & Forecast (Google Sheet)
$11.11
-

Digital download
Cash Flow Excel Dashboard Template – Financial Reporting, Dynamic Charts
$19.33
-

Digital download
Cash Flow Forecast Template Excel, Expense Tracking Spreadsheet, Business Cash Flow Template, Cost Projection Template, Financier Tracker
$22.43
-

Digital download
CFO Dashboard Excel Template: Financial Metrics Report (Google Sheet/MS Excel)
$11.11
-

Digital download
Finance KPI Dashboard Excel Template | Track & Analyze Financial Metrics | Monthly Cumulative Reports | Dynamic Charts | Easy to Use
Sale Price $8.50
Original Price $17.00
Shoppers with similar taste loved these
-
Digital download
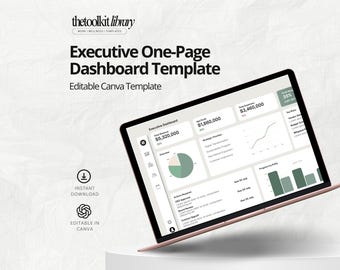
Executive One-Page Dashboard Template – Canva Editable
$9.99
-

Digital download
Beige Social Media Analytics Report template | Social Media Performance Report | Canva monthly presentation | Business Audit | KPI dashboard
Sale Price $5.27
Original Price $17.56
-

Digital download
Sales Strategy Plan Presentation Template | PowerPoint, Canva, Google Slides, Keynote
Sale Price $3.75
Original Price $5.00
-

Digital download
Minimal Blue Powerpoint Template | PPT Minimalist | Persentation Slide | Business Strategy | Slide Deck
$5.50
-
Digital download
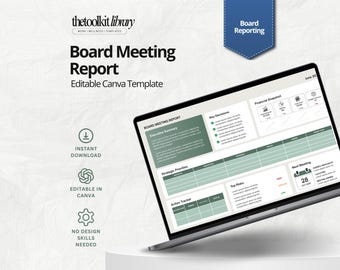
Board Meeting Report Template
$9.99
-

Digital download
Project Implementation Plan Sheet – Editable Excel and Google Sheets Template for Project Management, Tracking & Reporting
Sale Price $5.83
Original Price $11.67
-
Digital download
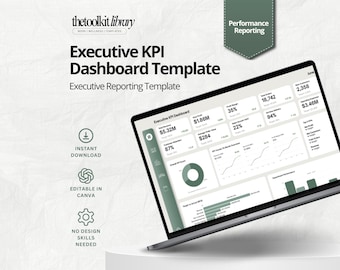
Executive KPI Dashboard Template (Editable Canva Template)
$9.99
-

Digital download
Simple Business Presentation Template
$24.00
-
Digital download
16000+ Microsoft Word Templates & Design Assets Mega Bundle (Organized)
Sale Price $10.96
Original Price $21.92
-

Digital download
OneNote Executive Command Center: Leadership & Productivity System 2027 - 2029 (Digital Download)
$19.53
-

Digital download
Customer Experience Guide | Small Business Customer Service and Staff Training Manual + Free Customer Survey Template
$14.01
-

Digital download
LinkedIn Banner Template Canva | Executive Header for Finance, Consulting & Tech | 10 Editable Profile Banner Designs
Sale Price $11.21
Original Price $22.43


