

Where the Rivers Meet Art Print, American and Sacramento Rivers, Sacramento Wall Art, Water Year 2026 River Flow Poster, Printable
Price:$12.00
Here's what's eligible:
- Your order doesn't match the item description or photos
- Your item arrived damaged
- Your item arrived after the estimated arrival window
- Your item didn't arrive or was lost in the mail
You can only make an offer when buying a single item
Highlights
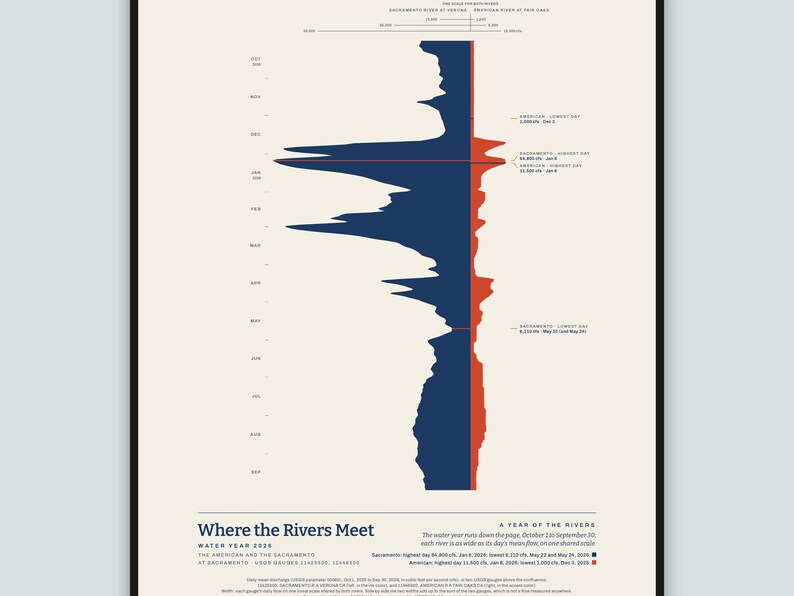
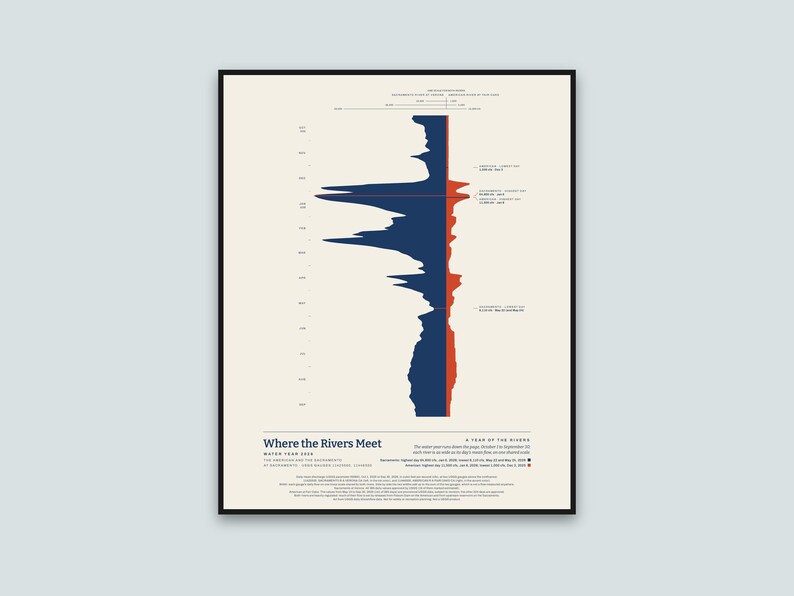
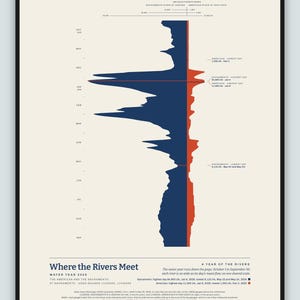
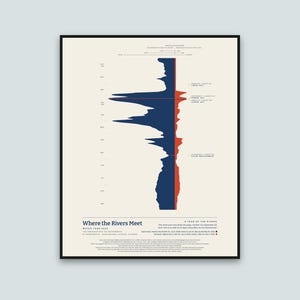
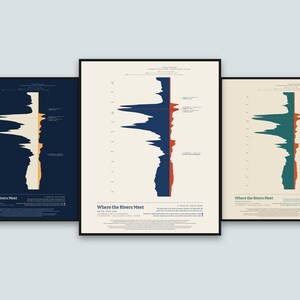
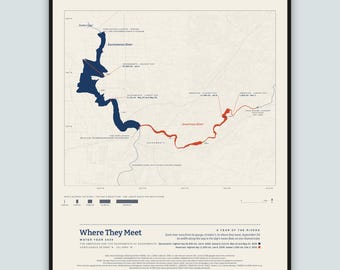
The American River and the Sacramento River through one whole year, drawn side by side as they come together at Sacramento: every day of the 2026 water year, October 1, 2025 to September 30, 2026, with each river's width set by that day's mean flow at its gauge above the confluence.
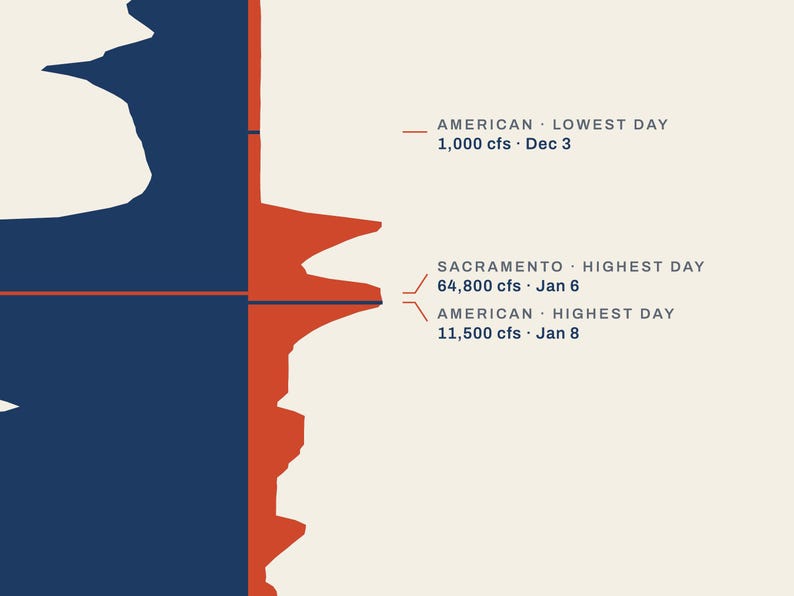
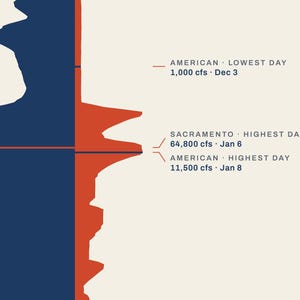
How to read it: October is at the top and September at the bottom, with the months marked on the left. The Sacramento (at Verona) runs on the left in the main ink and the American (at Fair Oaks) on the right in the accent color. Both are drawn on one shared straight scale, so you can see how much water each brings; the thin lines across the top show widths of 10,000, 25,000 and 50,000 cubic feet per second on the left and 1,000, 5,000 and 10,000 on the right. Side by side the two widths add up to the sum of the two gauges, which is not a flow measured anywhere. Each river's highest and lowest day are marked across its own stream: the Sacramento's highest day was 64,800 cubic feet per second on January 6, 2026 and its lowest 6,110 on May 22 and May 24, 2026; the American's highest day was 11,500 cubic feet per second on January 8, 2026 and its lowest 1,000 on December 3, 2025. The highest day is the highest daily mean, not the moment of highest water. It is a picture of the year, not a chart for reading values.
The data: USGS daily mean streamflow (discharge, in cubic feet per second) at USGS gauge 11425500, SACRAMENTO R A VERONA CA, 1.5 miles below the Feather River, and USGS gauge 11446500, AMERICAN R A FAIR OAKS CA, for the water year October 1, 2025 to September 30, 2026, drawn by my own software from the published daily values. All 365 of the Sacramento's daily values are approved by USGS (16 of them marked by USGS as estimated). Part of the American's year, May 13 to September 30, 2026 (141 of the 365 days), is provisional USGS data, which USGS may still revise; the other 224 days are approved. The poster prints the same note.
Both rivers are heavily regulated: much of their flow is set by releases from Folsom Dam on the American and from upstream reservoirs on the Sacramento.
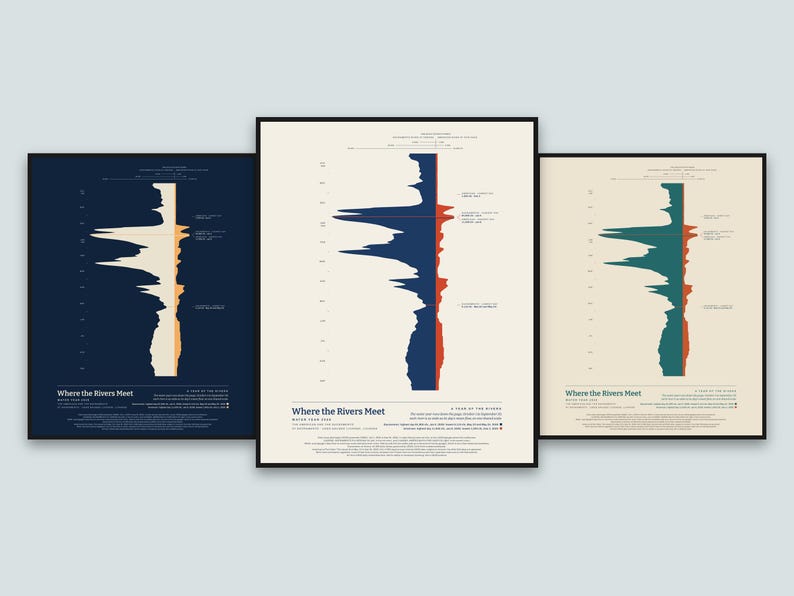
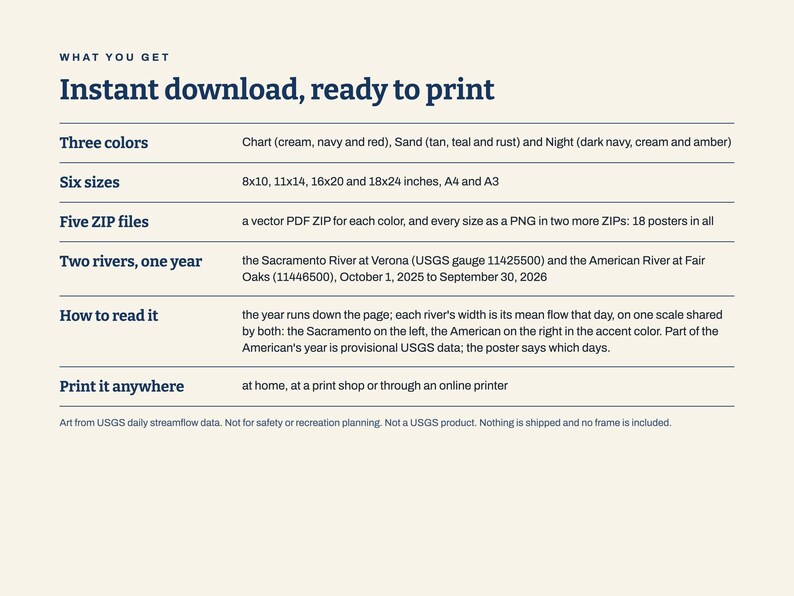
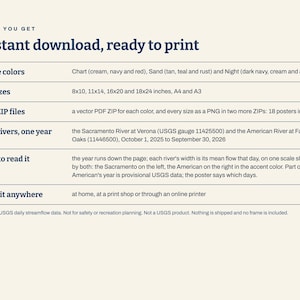
What you get: five ZIP files. Three hold the print-ready vector PDFs, one ZIP for each color: Chart (cream, navy and red), Sand (tan, teal and rust) and Night (dark navy, cream and amber), each in six sizes (8x10, 11x14, 16x20 and 18x24 inches, A4 and A3). The other two hold the same posters as PNG pictures in all three colors: one for 8x10, 11x14 and A4 (300 dots per inch), one for 16x20, 18x24 and A3 (200 dots per inch). This is an instant digital download. Nothing is shipped and no frame is included; you print it at home, at a print shop or through an online printer. For your own personal use.
Please note: Art from USGS daily streamflow data. Not for safety or recreation planning. Not a USGS product. Not reviewed or endorsed by USGS.
The photos show the poster in frames on a wall to show how it looks hung; the frames and the wall are not part of the order.
The layout and the software were made with the help of AI tools; the shape is computed from the USGS data.
Instant Download
Your files will be available to download once payment is confirmed. Here's how.
Instant download items don’t accept returns, exchanges or cancellations. Please contact the seller about any problems with your order.
Etsy Purchase Protection
Shop confidently on Etsy knowing if something goes wrong with an order, we've got your back for all eligible purchases —
see program terms


More from this shop
Visit shop-
Digital download
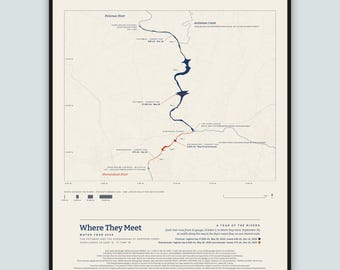
Where They Meet Art Print, Potomac and Shenandoah River Map, Harpers Ferry Wall Art, Water Year 2026 River Flow Poster, Printable
$12.00
-
Digital download
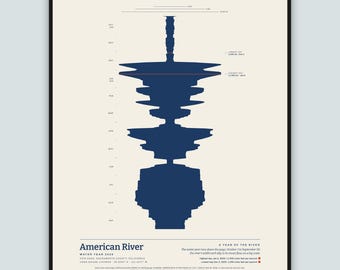
American River Art Print, Sacramento Wall Art, Fair Oaks Folsom Gift, Water Year 2026 River Flow Poster, Streamflow Data Art, Printable
$10.00
-
Digital download
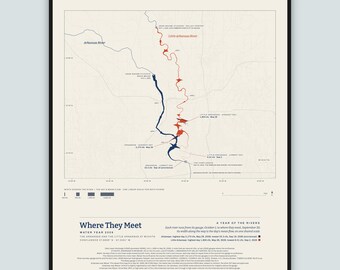
Where They Meet Art Print, Arkansas and Little Arkansas River Map, Wichita Wall Art, Water Year 2026 River Flow Poster, Printable
$12.00
-
Digital download
Where They Meet Art Print, American and Sacramento River Map, Sacramento Wall Art, Water Year 2026 River Flow Poster, Printable
$12.00
Be the first to leave a review
Shoppers with similar taste loved these
-
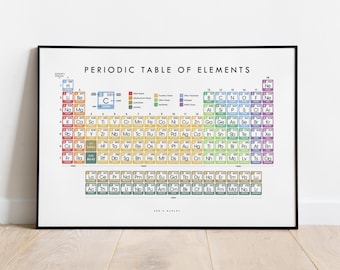
Periodic Table of Elements Print, Educational Science Classroom Wall Art
Sale Price $46.76
Original Price $55.01
-

Original White Cloud Wall Art, Large Cloudy Sky Abstract Painting, Pink Cloudscape Canvas, Navy Blue Living Room Wall Art
Sale Price $101.00
Original Price $202.00
-
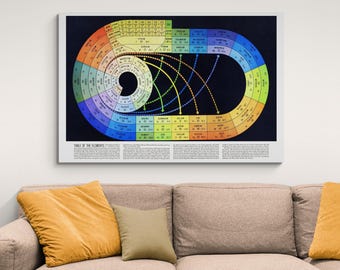
Spiral Periodic Table of Elements | Chemistry Science Classroom Print | Atomic Structure Wall Art
Sale Price $65.99
Original Price $87.99
-
Ripples, watercolor print, river rocks in a stream
$15.00
-
1979 Geological Colorado Map Print, Topographic Shaded Relief Wall Art Poster
$79.00
-

Rainbow Spiral Periodic Table Print: Vintage 1940s Science Art
$34.95
-

Radiant Energy Spectrum Chart | Electromagnetic Waves and Light Diagram | Vintage Physics Science Wall Art
Sale Price $65.99
Original Price $87.99
-
Colorado Topographic Map Print: Retro Style Shaded Wall Art - USA
$37.12
-
Gingery Projection World Map Poster
$48.19
-

World - Mercator Projection - V1
$43.00
-

Wood wall art large size, wooden wall decor modern rustic piece, decorative wall art for the home, living room decor, wooden wall decor
$415.00
-

World - Winkel Tripel projection - V1
$43.00

