

Where They Meet Art Print, Potomac and Shenandoah River Map, Harpers Ferry Wall Art, Water Year 2026 River Flow Poster, Printable
Price:$12.00
Here's what's eligible:
- Your order doesn't match the item description or photos
- Your item arrived damaged
- Your item arrived after the estimated arrival window
- Your item didn't arrive or was lost in the mail
You can only make an offer when buying a single item
Highlights
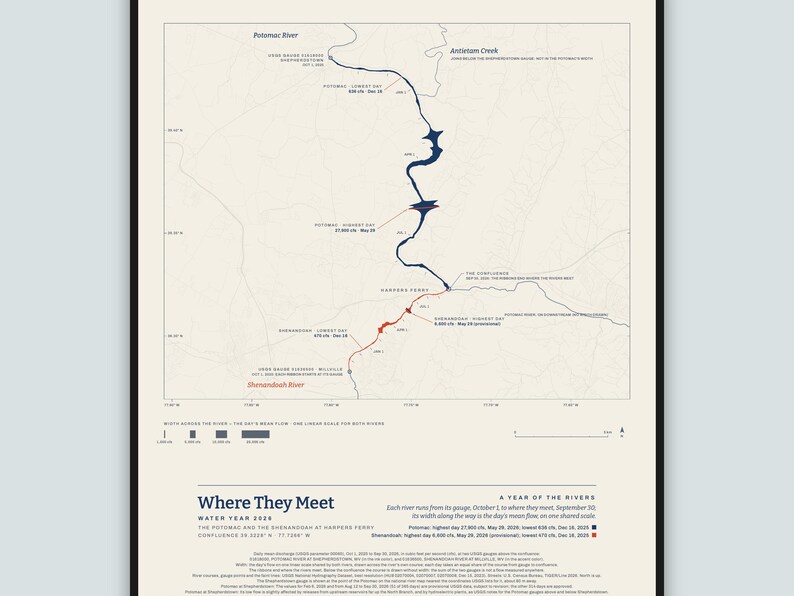
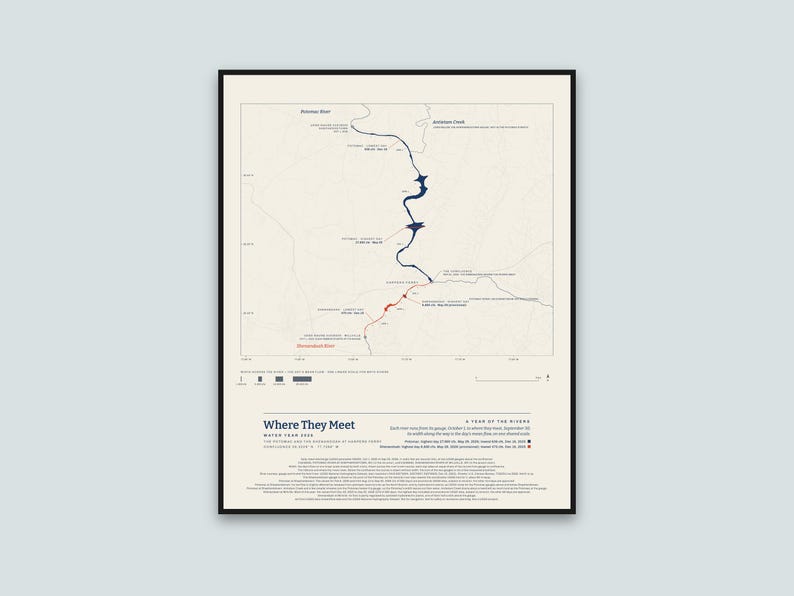
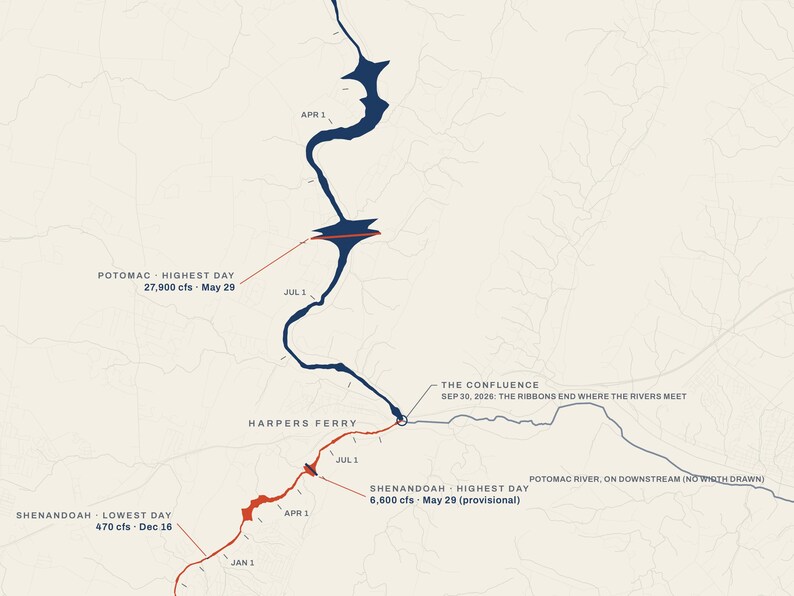
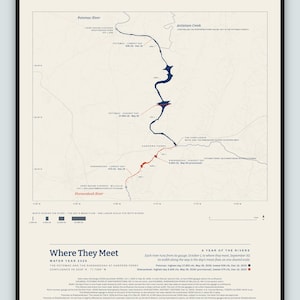
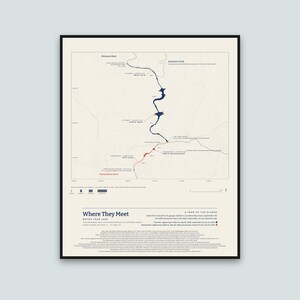
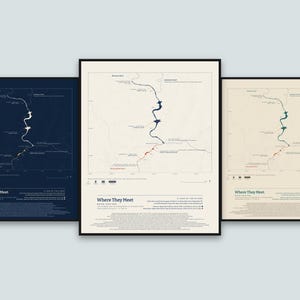
The Potomac River and the Shenandoah River on a map of Harpers Ferry, each drawn along its real course from its USGS gauge to the place where the two rivers meet: every day of the 2026 water year, October 1, 2025 to September 30, 2026, with each river's width along the way set by that day's mean flow.
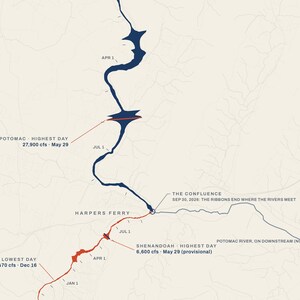
How to read it: each river starts at its gauge on October 1 (the Potomac at Shepherdstown, the Shenandoah at Millville) and runs downstream a day at a time, reaching the confluence on September 30, so the two years end together where the rivers meet. The width across each river is that day's mean flow, on one straight scale shared by both rivers; the bars under the map show widths of 1,000, 5,000, 10,000 and 25,000 cubic feet per second. The width is a picture of flow, not the river's real width: in the late May high water the Potomac spreads far past its banks on the map, and through the low autumn both rivers are threads. The ribbons end where the rivers meet. Below the confluence the course is drawn without width: the sum of the two gauges is not a flow measured anywhere. Each river's highest and lowest day are marked across it: the Potomac's highest day was 27,900 cubic feet per second on May 29, 2026 and its lowest 636 on December 16, 2025; the Shenandoah's highest day was 6,600 cubic feet per second on May 29, 2026 and its lowest 470 on December 16, 2025. The highest day is the highest daily mean, not the moment of highest water. It is a picture of the year, not a chart for reading values.
The data: USGS daily mean streamflow (discharge, in cubic feet per second) at USGS gauge 01618000, POTOMAC RIVER AT SHEPHERDSTOWN, WV, and USGS gauge 01636500, SHENANDOAH RIVER AT MILLVILLE, WV, for the water year October 1, 2025 to September 30, 2026, drawn by my own software from the published daily values. The river courses and the faint lines of the map come from the USGS National Hydrography Dataset. The faint streets come from the U.S. Census Bureau's TIGER/Line road files (2026). The Shepherdstown gauge is shown at the point of the Potomac on the national river map nearest the coordinates USGS lists for it, about 80 m away. Part of the Potomac's year, February 6, 2026 and August 12 to September 30, 2026 (51 of the 365 days), is provisional USGS data, which USGS may still revise; the other 314 days are approved. Most of the Shenandoah's year, December 29, 2025 to September 30, 2026 (276 of the 365 days, including the highest day, May 29), is provisional USGS data, which USGS may still revise; the other 89 days are approved. The poster prints the same note.
The Potomac's low flow at Shepherdstown is slightly affected by releases from upstream reservoirs far up the North Branch, and by hydroelectric plants, as USGS notes for its Potomac gauges above and below Shepherdstown. Antietam Creek and a few smaller streams join the Potomac below the Shepherdstown gauge, so the Potomac's width on the map leaves out their water; Antietam Creek drains about a twentieth as much land as the Potomac at the gauge. The Shenandoah's flow at Millville is partly regulated by upstream hydroelectric plants, one of them half a mile above the gauge.
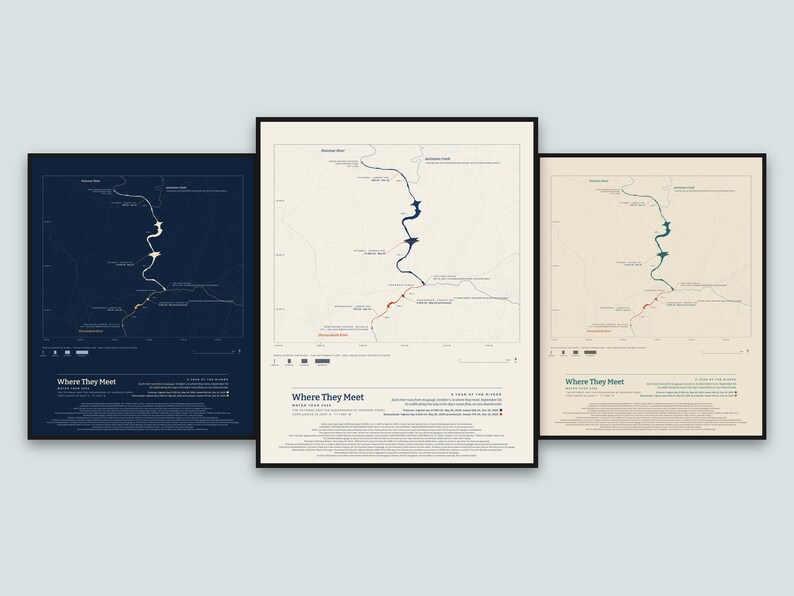
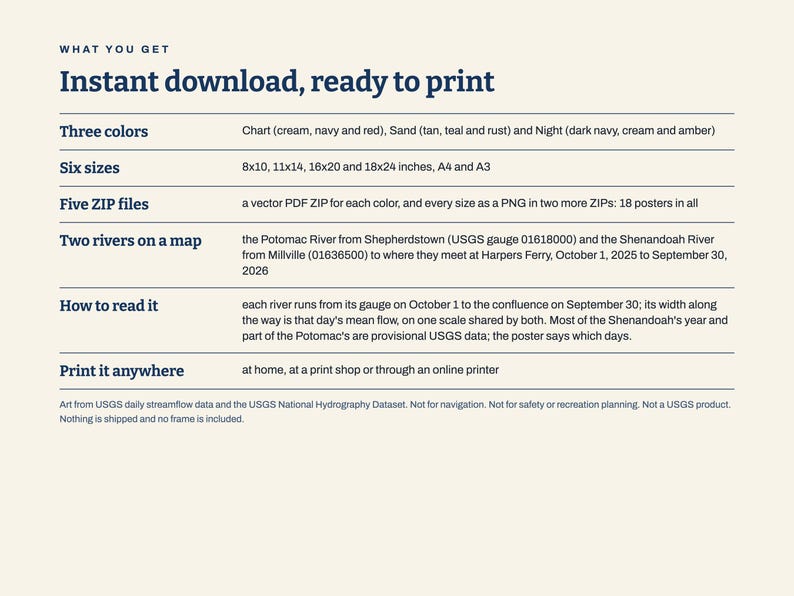
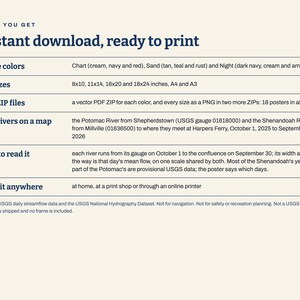
What you get: five ZIP files. Three hold the print-ready vector PDFs, one ZIP for each color: Chart (cream, navy and red), Sand (tan, teal and rust) and Night (dark navy, cream and amber), each in six sizes (8x10, 11x14, 16x20 and 18x24 inches, A4 and A3). The other two hold the same posters as PNG pictures in all three colors: one for 8x10, 11x14 and A4 (300 dots per inch), one for 16x20, 18x24 and A3 (200 dots per inch). This is an instant digital download. Nothing is shipped and no frame is included; you print it at home, at a print shop or through an online printer. For your own personal use.
Please note: Art from USGS daily streamflow data and the USGS National Hydrography Dataset. Not for navigation. Not for safety or recreation planning. Not a USGS product. Not reviewed or endorsed by USGS.
The photos show the poster in frames on a wall to show how it looks hung; the frames and the wall are not part of the order.
The layout and the software were made with the help of AI tools; the map and the shapes are computed from the USGS data.
Instant Download
Your files will be available to download once payment is confirmed. Here's how.
Instant download items don’t accept returns, exchanges or cancellations. Please contact the seller about any problems with your order.
Etsy Purchase Protection
Shop confidently on Etsy knowing if something goes wrong with an order, we've got your back for all eligible purchases —
see program terms


More from this shop
Visit shop-
Digital download
American River Art Print, Sacramento Wall Art, Fair Oaks Folsom Gift, Water Year 2026 River Flow Poster, Streamflow Data Art, Printable
$10.00
-
Digital download
Where They Meet Art Print, Arkansas and Little Arkansas River Map, Wichita Wall Art, Water Year 2026 River Flow Poster, Printable
$12.00
-
Digital download
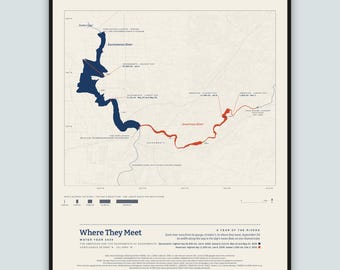
Where They Meet Art Print, American and Sacramento River Map, Sacramento Wall Art, Water Year 2026 River Flow Poster, Printable
$12.00
-
Digital download
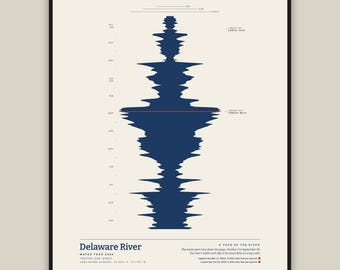
Delaware River Art Print, Trenton New Jersey Wall Art, Water Year 2026 River Flow Poster, Streamflow Data Art, Printable, Six Sizes
$10.00
Be the first to leave a review
Shoppers with similar taste loved these
-
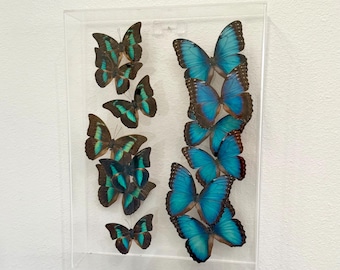
Framed Belize Blue Morpho Butterfly Art: Clear Acrylic Display (15.5x11.375x3.125 inches)
$395.00
-
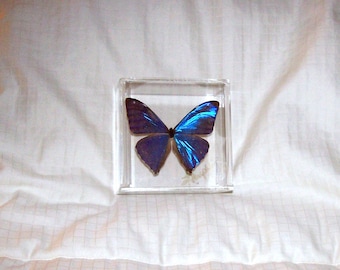
Real and Rare Iridescent and Metallic Blue Morpho Butterfly
$89.95
-
Blue Pearls 3D Flight -28x18 Acrylic Frame - Real Morpho butterflies
$1,149.00
-

Preserved Blue Morpho Menelaus Butterfly In Glass Dome
$99.99
-

Flight of the Blue Morphos - 18x28 3D Acrylic Framed Real Morpho Butterflies
$1,299.00
-

Real butterflies under a glass dome, gold on a pedestal - Morpho peleides
$154.91
-

El Yunque National Park Print: Angelito Trail, Puerto Rico Black and White Photography
$32.00
-
Fern from El Yunque II Photo Print
$24.00
-
Cypress Trees at River Black and White Photo Fine Art Print, Giclee Print, Nature Photography
$20.00
-

Grass On Abandoned Railroad, Black and White Photo, Fine Art Photography, Giclee Print
$20.00
-

El Yunque Rainforest Prints, Black and White Puerto Rico Wall Art, Yokahú Tower Photography
$99.00
-

Black And White Print, Nature Wall Art, Minimalist Framed Art, Landscape Home Decor, Scenic Poster, Water Fine Art, Photography, Alps
Sale Price $28.83
Original Price $41.18
