Analytics

5,000+ items
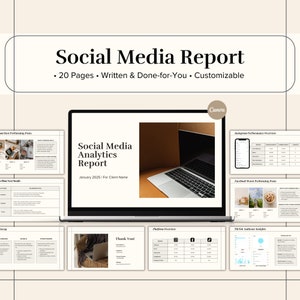
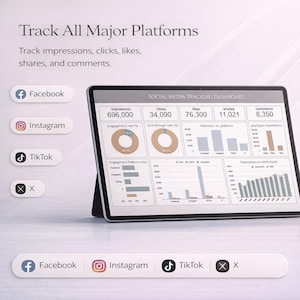
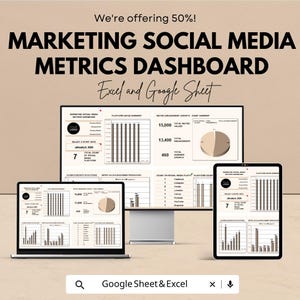
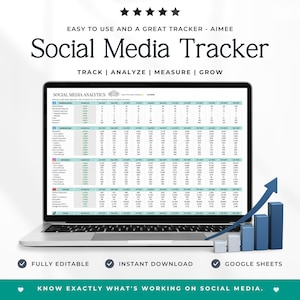
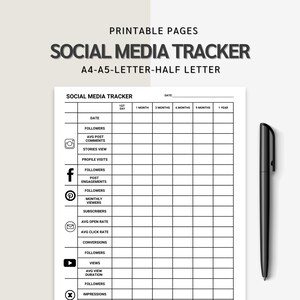
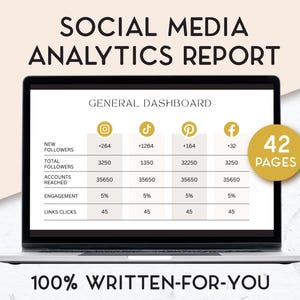
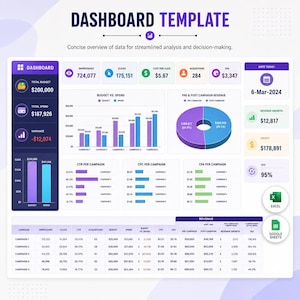
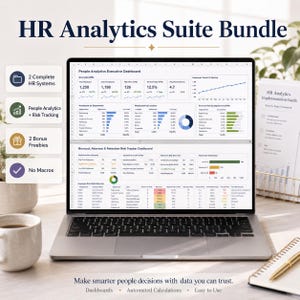
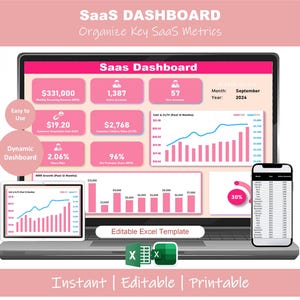
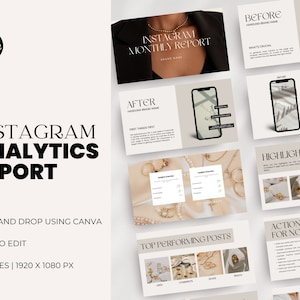
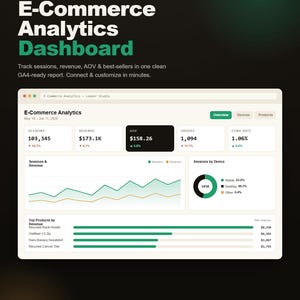
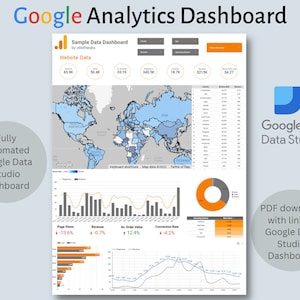
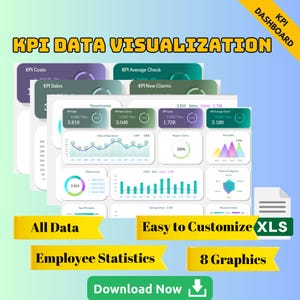
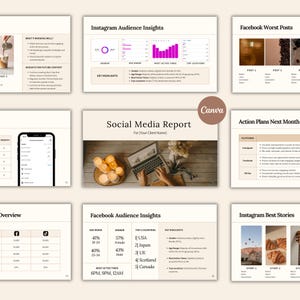
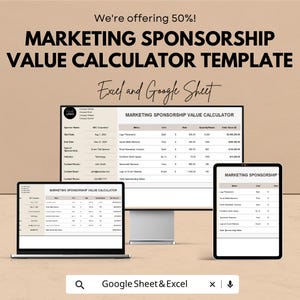
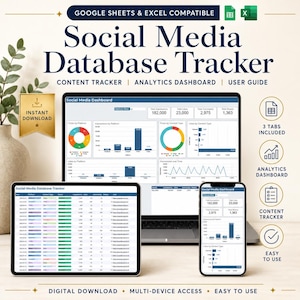
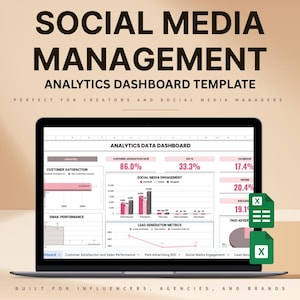
Explore insightful analytics tools, from data stickers to marketing dashboards.

Summarized based on similar shopper trends using AI

Review spotlight

Common Questions

Answers based on page-topic info using AI

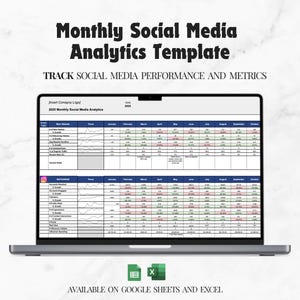
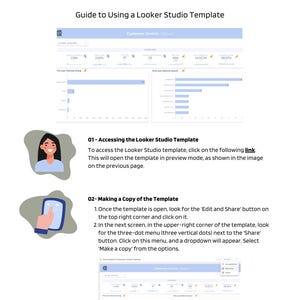
Analytics spreadsheet templates are often made for beginners through intermediate users, with guided tabs, pre-built charts, and labeled input cells so you can start tracking quickly. Plenty of analytics dashboards also suit advanced users by including complex formulas, pivot-style summaries, and multi-sheet reporting. Skill level varies by item, so check whether instructions, examples, or editable calculations are included.
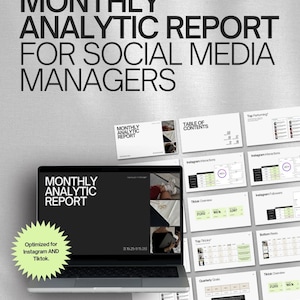
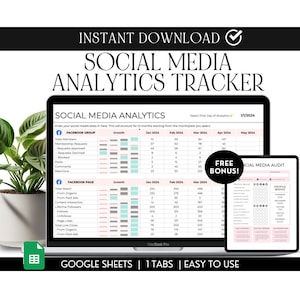
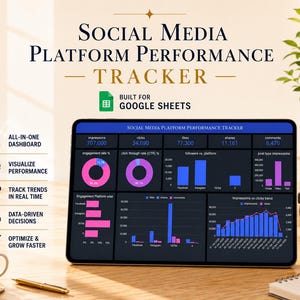
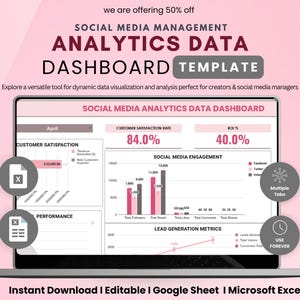
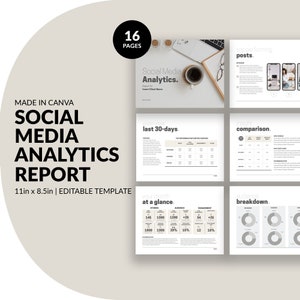
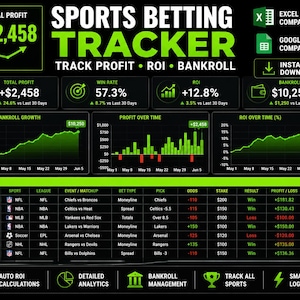
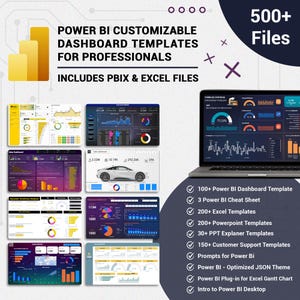
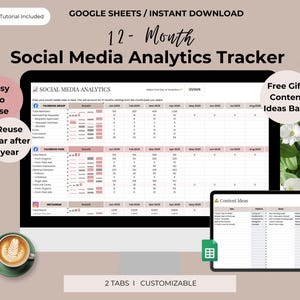
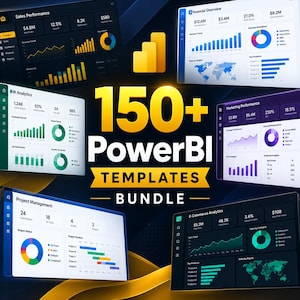
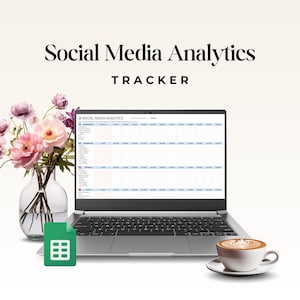
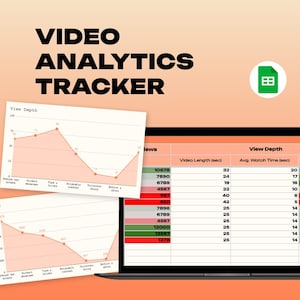
Analytics dashboards typically work with spreadsheet tools first, since many items are built as XLSX files or Google Sheets templates with formulas, pivot-style summaries, and charts. You’ll also find dashboards designed for presentation tools, delivered as editable slides or report layouts in PDF. Some items include CSV import tabs or sample data sheets for quick setup.
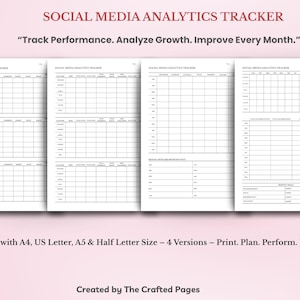
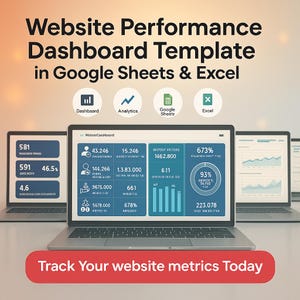
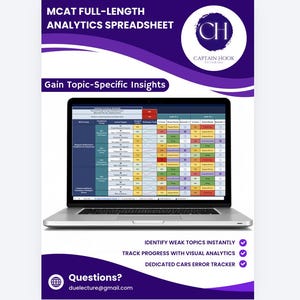
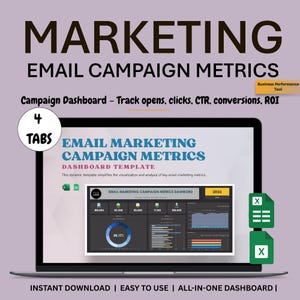
Yes, a number of analytics items can be customized to track your specific metrics and KPIs, especially spreadsheet dashboards and reporting templates with editable fields, formulas, and chart sections. Customization varies by item—some include built-in KPI menus or metric libraries, while others require manual edits. For deeper changes, like new calculations or data connectors, contact the seller.
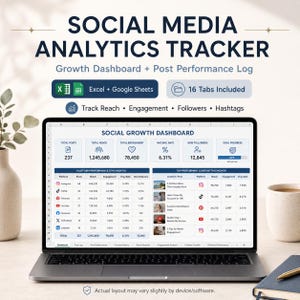
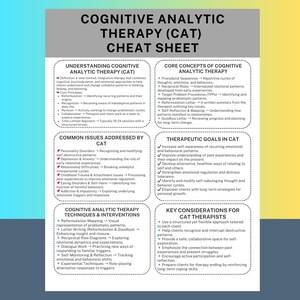
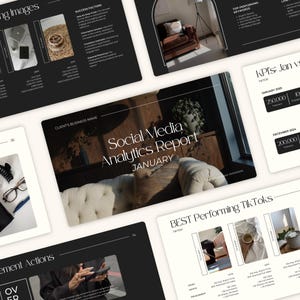
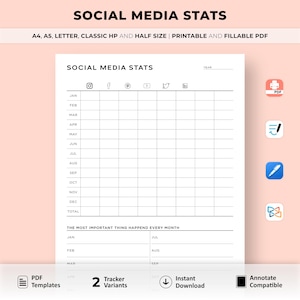
Many analytics templates are delivered as spreadsheet files like XLSX or Google Sheets-ready formats, since they’re built for formulas, charts, and dashboards. You’ll also see printable or fillable PDF planners, plus editable PNG or Canva-style files for trackers and report layouts. Digital downloads are typically provided as instant files or share links, depending on the item.
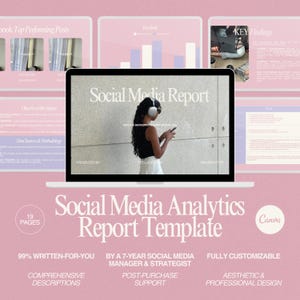
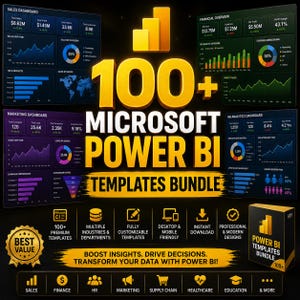
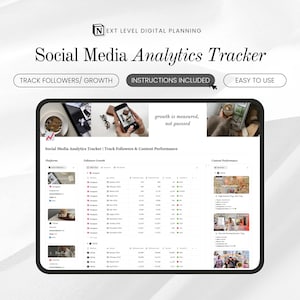
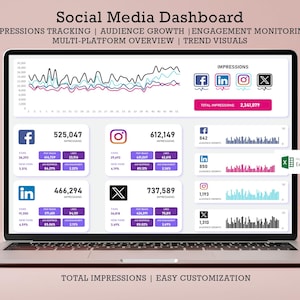
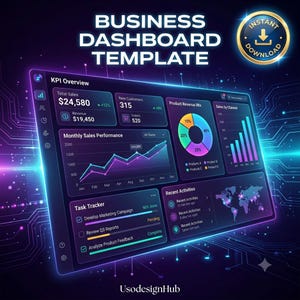
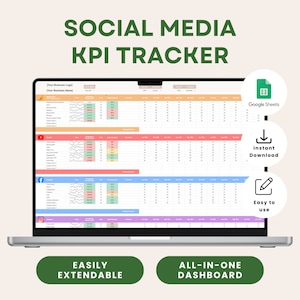
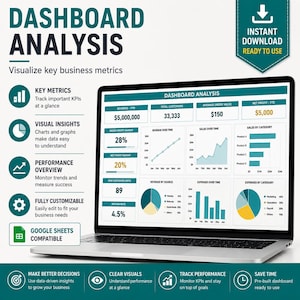
You’ll find analytics dashboard designs in a range of looks, from minimalist layouts with clean grids and muted color palettes to bold, high-contrast themes made for quick scanning. Several items use modern card-style widgets, progress bars, and sparkline charts, while others lean toward planner-like trackers with icons, color-coding, and neatly labeled sections for KPIs and notes.