Inventory Spreadsheet

5,000+ items
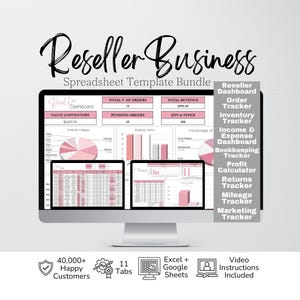
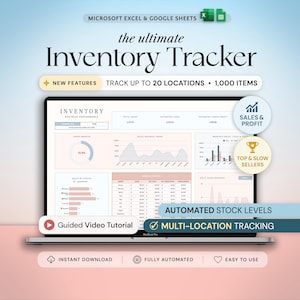
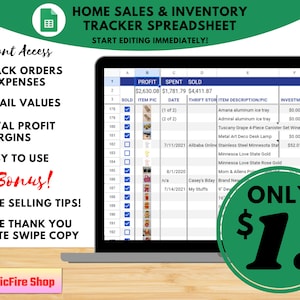
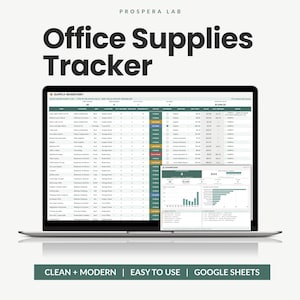
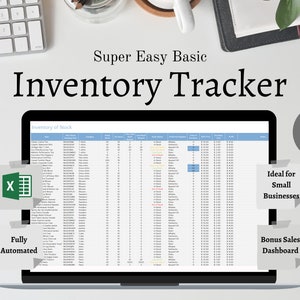
Organize your business with smart inventory spreadsheets. Find automated trackers for small businesses, home inventory, and craft businesses, all designed to simplify your stock and sales management.

Summarized based on similar shopper trends using AI

Review spotlight

Common Questions

Answers based on page-topic info using AI

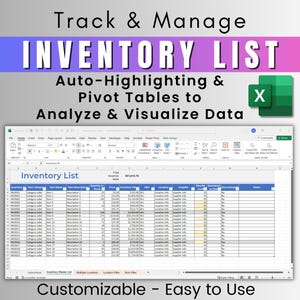
Yes, a number of inventory spreadsheet items are designed so you can add your own columns and categories as your tracking needs grow. In Excel or Google Sheets formats, you can typically insert new fields for things like location, variants, vendor codes, or reorder notes, and extend dropdown lists for categories. Just keep formulas, totals, and dashboards aligned when expanding tables.
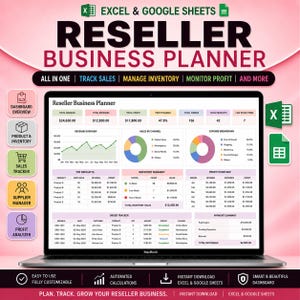
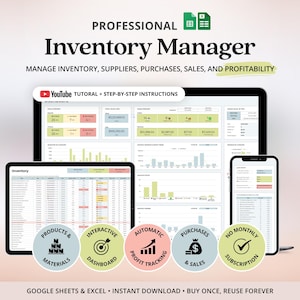
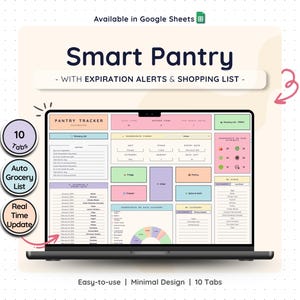
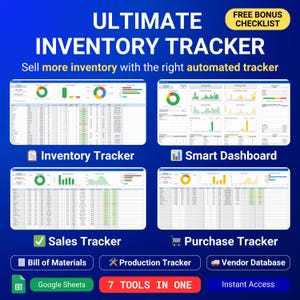
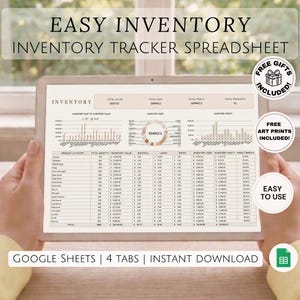
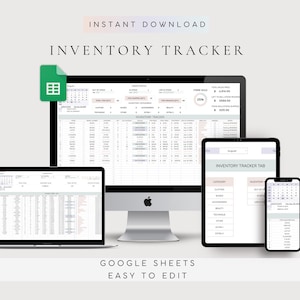
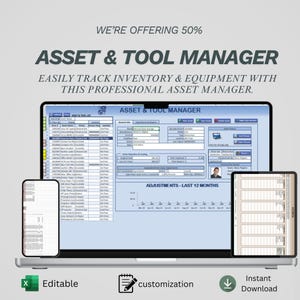
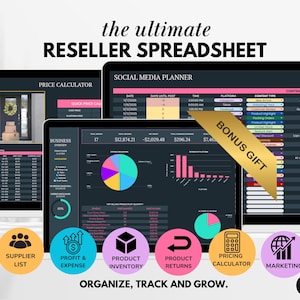
Yes, plenty of inventory spreadsheet items are organized into separate tabs so your data stays clean and easy to update. You’ll often find a Products or Stock tab, a Suppliers or Vendor List tab, and a Sales or Transactions tab where entries subtract from on-hand quantities. Some inventory spreadsheet items combine sales and purchases into one log instead of splitting them.
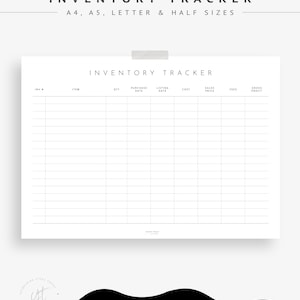
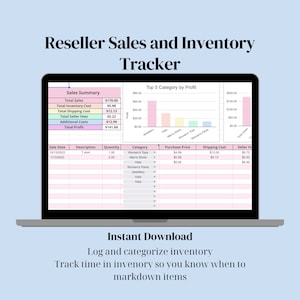
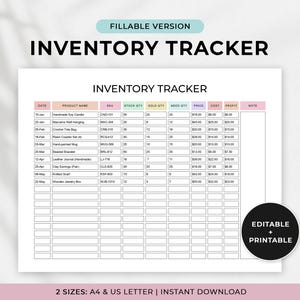
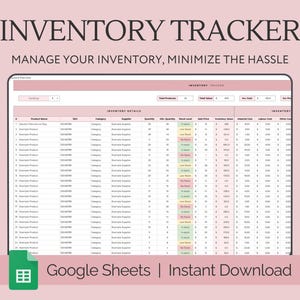
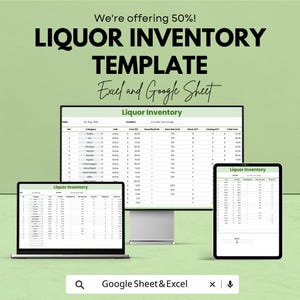
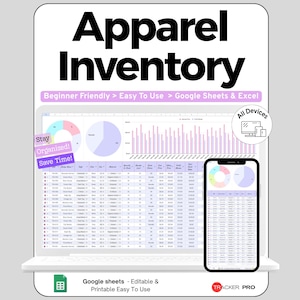
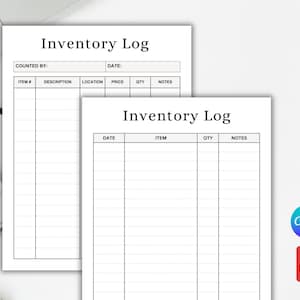
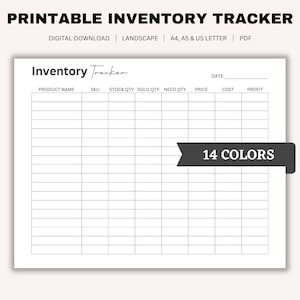
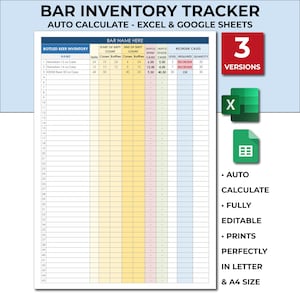
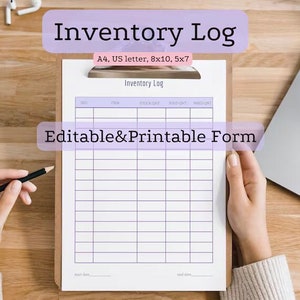
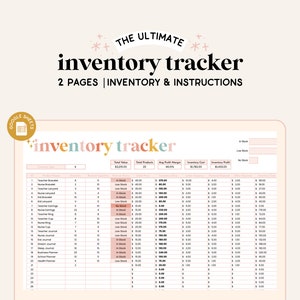
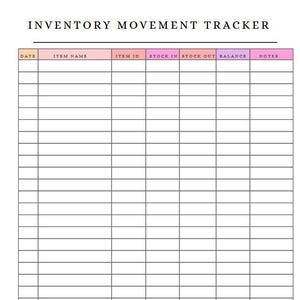
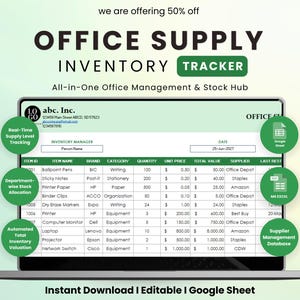
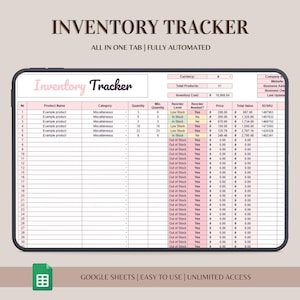
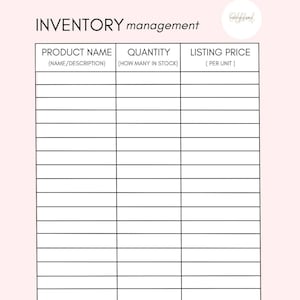
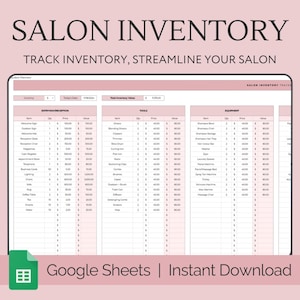
You’ll typically see an inventory spreadsheet set up with columns for item name or SKU, category, supplier, purchase cost, selling price, stock on hand, reorder point, and location or bin. Many inventory spreadsheet items also add barcode/variant fields (size, color), sales and restock dates, notes, and automatic inventory value totals. Some include status tags like discontinued or backordered.

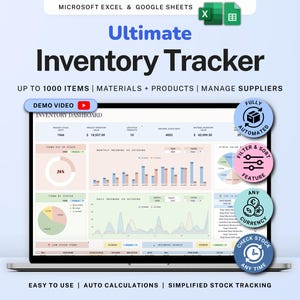
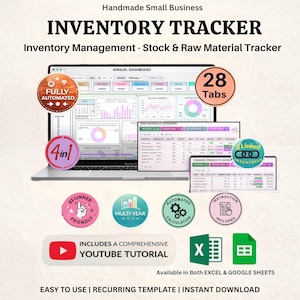
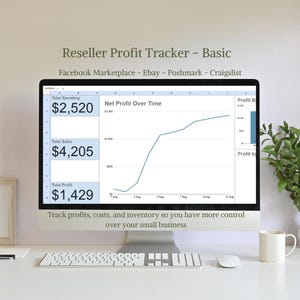
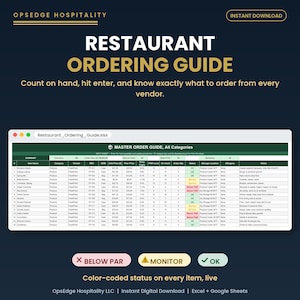
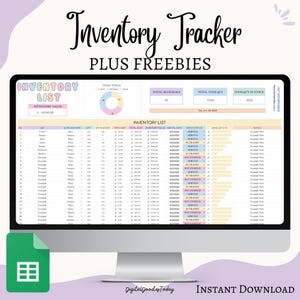
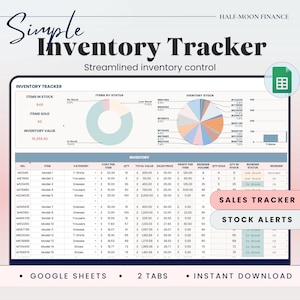
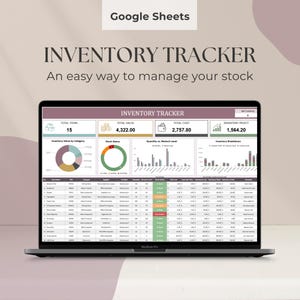
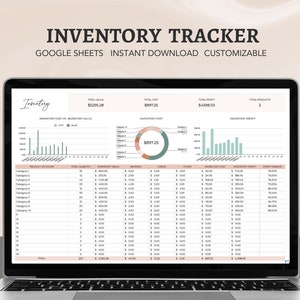
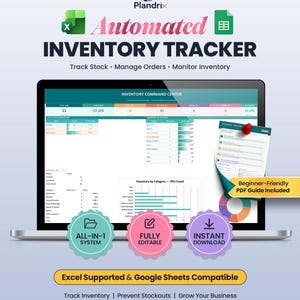
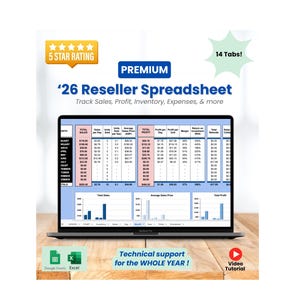
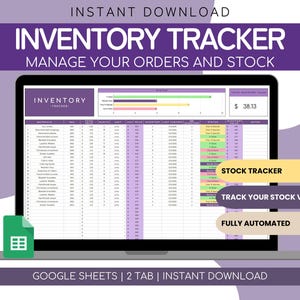
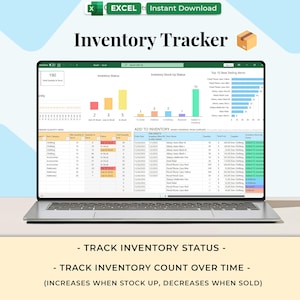
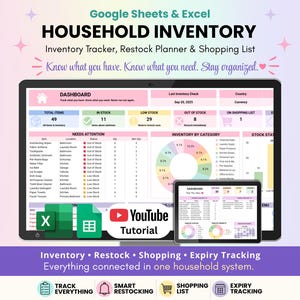
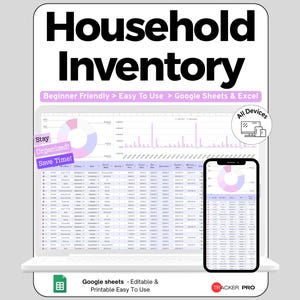
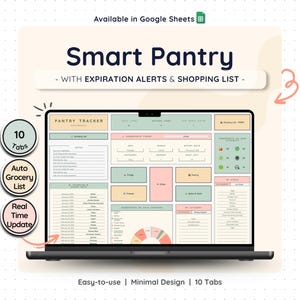
Yes, many inventory spreadsheet templates include a dashboard tab with built-in charts for quick reporting, such as stock on hand, low-stock alerts, inventory value, and category breakdowns. You’ll often see color-coded conditional formatting and summary tables that update as you enter purchases and sales. Some items keep reporting simple with basic totals instead of charts.
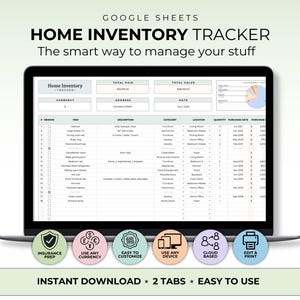
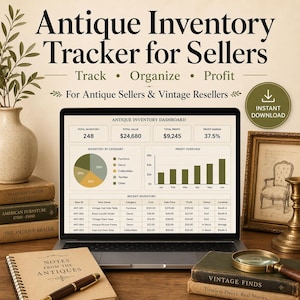
Yes, several inventory spreadsheet items can track multiple locations by adding fields like warehouse, store, bin, or shelf, then using filters or pivot tables to view stock by site. You’ll often see separate tabs for each location or a single master table with a Location dropdown. Just check whether totals roll up across locations automatically.