Sending less to the landfill
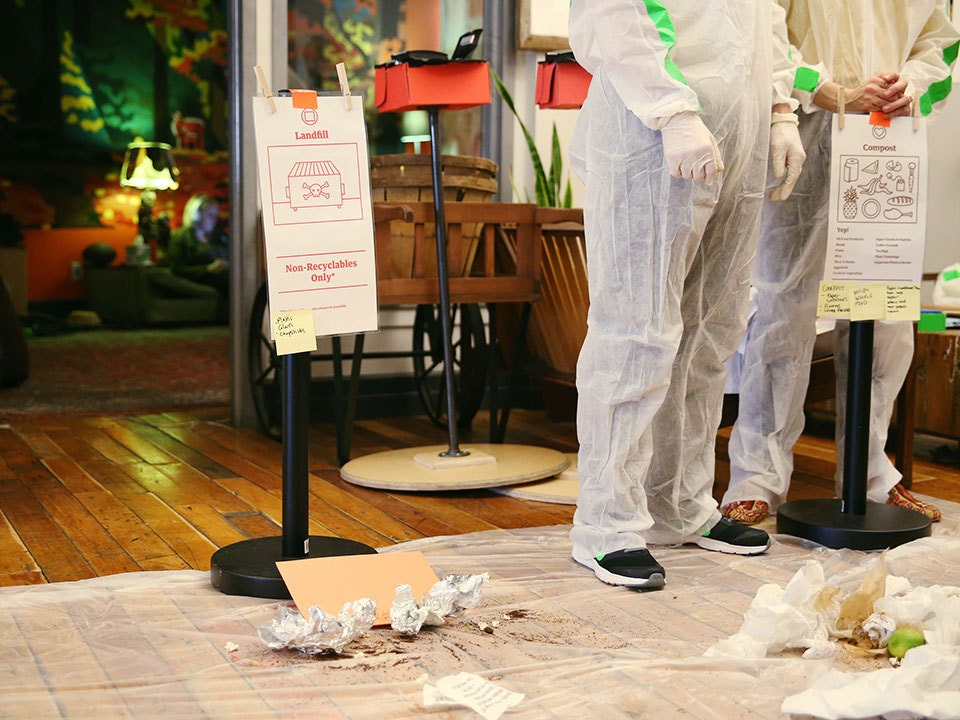
We’re continuously working to both reduce our waste and keep as much of it as possible out of landfills. In 2015, we expanded recycling and composting across our offices, increased our thoughtfulness about the packaging and products we bring into the office, and engaged employees through educational events.
These efforts made a difference. Between 2014 and 2015, we increased our landfill diversion rate by 9%. In total, we diverted 19.16 metric tons of waste from landfills through our recycling and compost efforts.
| Year | % Diversion from landfill |
|---|---|
| 2013 | 53 |
| 2014 | 67 |
| 2015 | 76 |
Our Dublin office diverted 92% of all waste from landfill through a robust compost programme and the introduction of events like 'Zero Waste Fridays'. Throughout the year waste bins were 'closed for business' on Fridays, prompting everyone to think about their waste - from bringing fewer coffee cups into the office, to finding new ways to reuse materials.
Consuming less, diverting our waste from landfill, and eventually getting to zero waste are priorities at Etsy. As part of a global community of makers, we deeply understand that materials matter. We prioritise goods that can be reused and upcycled in our offices or recycled by our waste partners, and we’ve crafted internal guidelines to support the purchase of these types of products.

We use a custom scale to measure waste that comes through Etsy’s offices, weighing all of our outgoing waste, recycling, compost and donation streams before items leave our offices. We then use this data to review trends and make decisions about how to improve diversion rates and engage employees around reducing waste.
| Waste | Percentage of total waste |
|---|---|
| Landfill | 23.55 |
| Waste incinerated (heat recovery) | 0.38 |
| Bottles & cans | 12.91 |
| Paper & cardboard | 23.31 |
| Compost | 29.81 |
| E-waste | 1.41 |
| Plastic bags | 0.31 |
| Other recycled | 5.77 |
| Donated textiles | 2.54 |
This represents actual data from the offices where 91% of our employees work. We have full year data from our Berlin, Brooklyn, Dublin, Hudson, London, Toronto and two Paris offices. Next year we’ll be able to share even more information about waste from our offices around the world.
The total waste that we sent to landfills decreased by 21% over the last year, despite the fact that our headcount increased by 24%. In addition, the pounds of waste we sent to landfill per person decreased by 39% between 2014 and 2015.
| Year | Kilos |
|---|---|
| 2013 | 34 |
| 2014 | 31 |
| 2015 | 18 |
_Methodology
We have full year data from our Berlin, Brooklyn, Dublin, Hudson, London, Toronto and two Paris* offices, which collectively account for approximately 91% of our employee population.
In Berlin, Brooklyn, Dublin, Hudson and Toronto, we’re using an automated waste measurement tool developed by our Office Hackers. Scales connected automatically send daily data directly to our data collection portal. This system was added to Berlin, Dublin and Toronto in 2015, and we expect to roll it out to our London, Paris and San Francisco offices in 2016.
In cases where we were missing data from a select week, we estimated it based on the average waste consumption at the office.
Our 2015 waste figures do not include estimates for work-based waste generated at home or in coworking spaces by remote workers. We plan to review our strategy for collecting this data in 2016.
*Both Paris offices used actual recycling data, and created an estimate for the landfill waste data based on a site-specific methodology. The offices are working to weigh all landfill waste in 2016. _